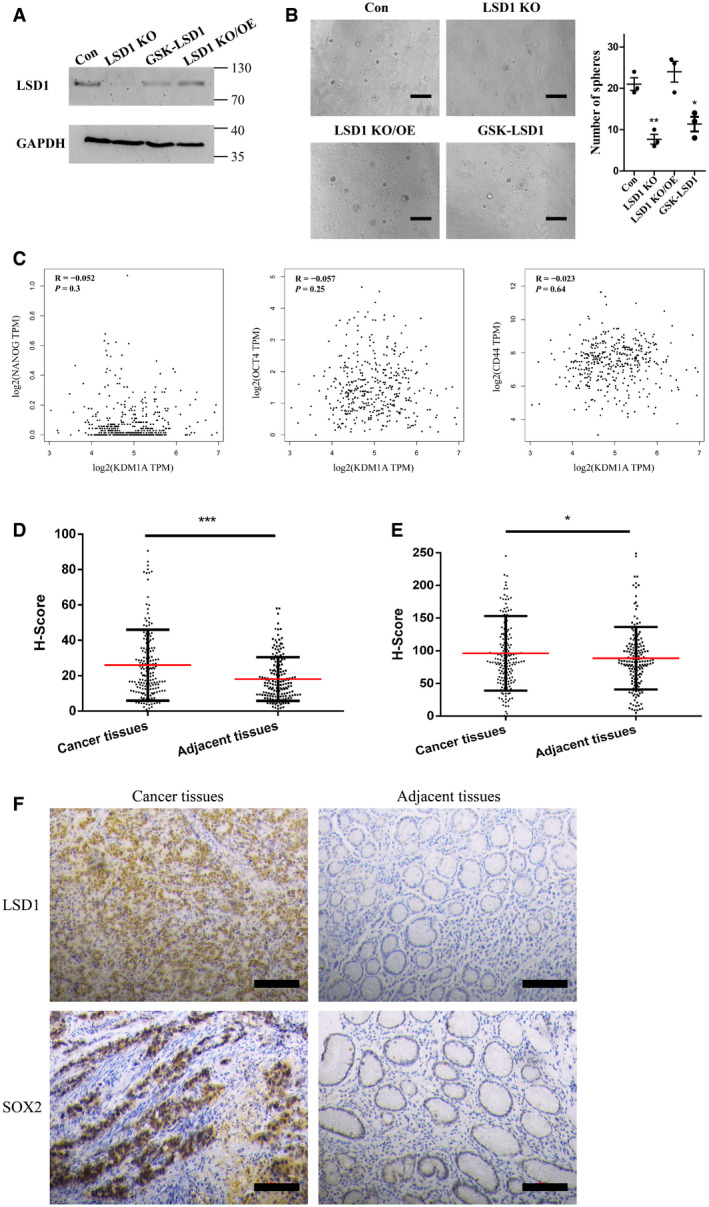
Figure EV2. LSD1 expression is correlated with gastric cancer cell stemness.

-
AExpression level of LSD1 in MGC‐803, LSD1 knockout (KO) MGC‐803, LSD1 KO MGC‐803 cells transfected with LSD1‐encoding plasmid, and GSK‐LSD1‐treated MGC‐803 cells. GAPDH was used as a loading control.
-
BSphere formation assay results of MGC‐803 cells subjected to different treatments as indicated in the figure. Scale bar = 100 µm (n = 3 biological replicates; mean ± standard error mean (SEM); **P = 0.0042 and *P = 0.0146; two‐tailed unpaired Student’s t‐test).
-
CCorrelation of LSD1 (KDM1A) with Nanog, OCT4, and CD44 determined using Gene Expression Profiling Interactive Analysis (GEPIA) datasets (Pearson’s test).
-
D, EExpression levels of LSD1 (D) and SOX2 (E) in 172 pairs of gastric cancer tissues and adjacent non‐cancerous tissues were examined using immunohistochemical analysis (n = 172 paired tissues; mean ± SEM; ***P < 0.0001 (LSD1) and *P = 0.0348 (SOX2); two‐tailed unpaired Student’s t‐test).
-
FRepresentative images are shown as indicated. Scale bar = 100 µm.
Source data are available online for this figure.
