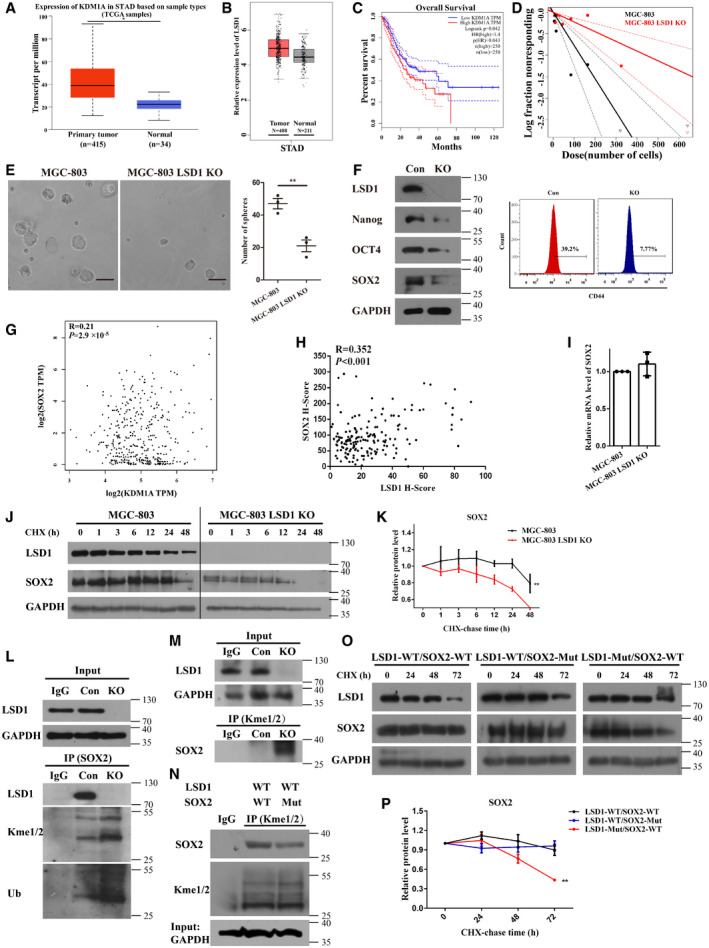
Figure 3. LSD1 facilitates stemness and promotes the accumulation of SOX2.

- Expression level of LSD1 (KDM1A) in gastric cancer and non‐cancerous tissues from UALCAN datasets (STAD, stomach adenocarcinoma; central band, boxes, and whiskers of the boxplot represent the median, first quartile, third quartile, minimum, and maximum values, respectively).
- Expression level of LSD1 (KDM1A) in gastric cancer or non‐cancerous tissues from Gene Expression Profiling Interactive Analysis (GEPIA) datasets (central band, boxes, and whiskers of the boxplot represent the median, first quartile, third quartile, minimum, and maximum values, respectively).
- Overall survival analysis using GEPIA datasets (log‐rank test; the solid line represents the survival curve, while the dashed line represents the 95% confidence interval).
- In vitro limiting dilution assay with MGC‐803 and LSD1 knockout (KO) MGC‐803 cells (the solid line represents the sphere formation ability curve, while the dashed line represents the 95% confidence interval).
- Sphere formation assay results of MGC‐803 and LSD1 KO MGC‐803 cells. Scale bar = 100 µm (n = 3 biological replicates; mean ± standard error mean (SEM); **P = 0.0058; two‐tailed unpaired Student’s t‐test).
- Expression levels of LSD1, Nanog, OCT4, SOX2, and CD44 in LSD1 KO MGC‐803 cells.
- Correlation between LSD1 and SOX2 mRNA levels analyzed using the GEPIA dataset (Pearson’s test).
- Correlation between LSD1 and SOX2 in 172 gastric cancer tissues (Pearson’s test).
- The mRNA levels of SOX2 in different cells were detected using quantitative real‐time polymerase chain reaction (n = 3 biological replicates; mean ± SEM).
- Stability of SOX2 in MGC‐803 and LSD1 KO MGC‐803 cells treated with cycloheximide (20 μM) at the indicated times.
- Relative intensity of SOX2 in (J) (n = 3 biological replicates, mean ± SEM).
- Immunoprecipitation of Kme1/2 and ubiquitin (Ub) with SOX2 in the presence or absence of LSD1. The cells were treated with MG132 (10 μM) for 8 h before analysis.
- Reverse immunoprecipitation of Kme1/2 on SOX2.
- Immunoprecipitation of Kme1/2 on SOX2 (WT indicates HEK293T cells co‐transfected with LSD1‐WT and SOX2‐WT; Mut indicates HEK293T cells co‐transfected with LSD1‐WT and SOX2‐Mut; WT, wild type; Mut, mutant).
- Stability of SOX2 in HEK293T cells co‐transfected with different plasmids (WT, wild type; SOX2‐Mut, K42R, and K117R mutations; LSD1‐Mut: K661A mutation).
- Relative intensity of SOX2 in (O) (n = 3 biological replicates; mean ± SEM; **P = 0.0055; two‐tailed unpaired Student’s t‐test).
Source data are available online for this figure.
