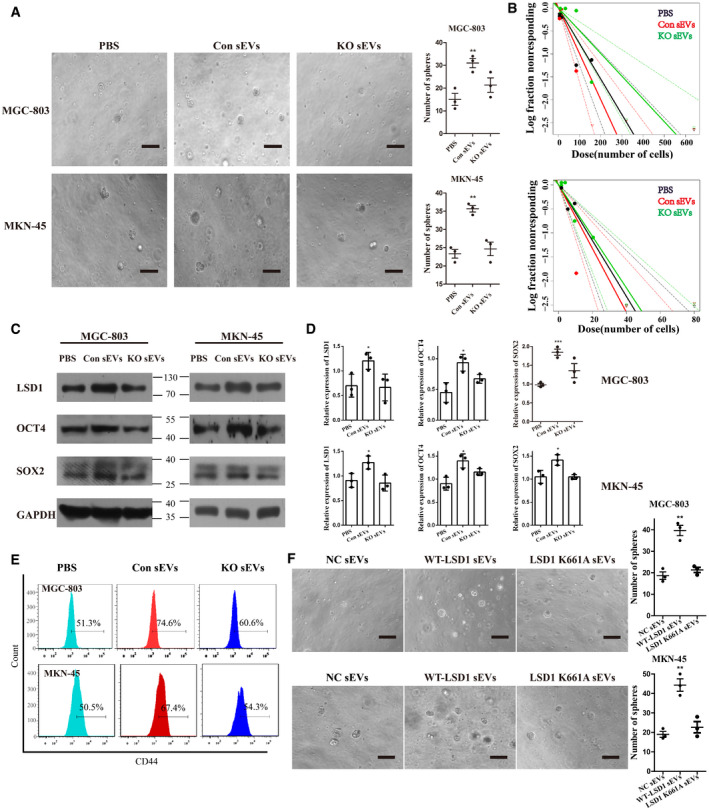
Figure 4. LSD1‐containing small extracellular vesicles (sEVs) promote cancer cell stemness in vitro .

- Sphere formation assay of MGC‐803 and MKN‐45 cells incubated with 20 μg/ml sEVs from MGC‐803 or LSD1 knockout (KO) MGC‐803 cells for 7 days (n = 3 biological replicates; mean ± standard error of mean (SEM); **P = 0.0090 (MGC‐803) and **P = 0.0012 (MKN‐45); two‐tailed unpaired Student’s t‐test; scale bar = 100 µm).
- In vitro limiting dilution assays performed using MGC‐803 (upper panel) and MKN‐45 (bottom panel) cells incubated with 20 μg/ml sEVs from MGC‐803 or LSD1 KO MGC‐803 cells for 14 days (the solid line represents the sphere formation ability curve, while the dashed line represents the 95% confidence interval. The circles and triangles represent data from different groups).
- Expression levels of LSD1, OCT4, and SOX2 in MGC‐803 and MKN‐45 cells incubated with 20 μg/ml sEVs from MGC‐803 or LSD1 KO MGC‐803 cells for 48 h.
- Quantification of the results of (C) (n = 3 biological replicates; mean ± SEM; *P = 0.0385 (LSD1), *P = 0.0160 (OCT4), and ***P = 0.0006 (SOX2) for MGC‐803; *P = 0.0299 (LSD1), *P = 0.0147 (OCT4), and *P = 0.0258 (SOX2) for MKN‐45; two‐tailed unpaired Student’s t‐test).
- Expression level of CD44 in MGC‐803 and MKN‐45 cells incubated with 20 μg/ml sEVs from MGC‐803 or LSD1 KO MGC‐803 cells for 48 h.
- Sphere formation assay results of MGC‐803 (upper panel) and MKN‐45 (bottom panel) cells incubated with 20 μg/ml sEVs from HEK293T cells (left panel), WT‐LSD1 sEVs (middle panel), and LSD1 K661A sEVs (right panel) for 7 days. Scale bar = 100 µm (n = 3 biological replicates; mean ± SEM; **P = 0.0021 (MGC‐803) and **P = 0.0020 (MKN‐45); two‐tailed unpaired Student’s t‐test).
Source data are available online for this figure.
