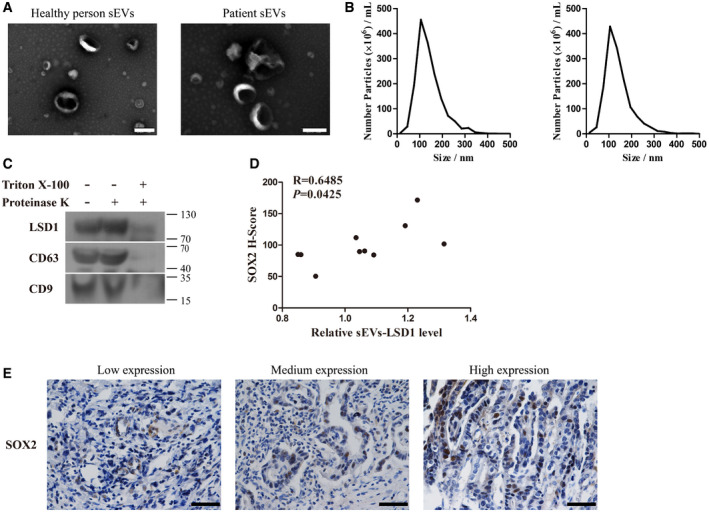
Figure EV4. Characterization of patient plasma‐derived small extracellular vesicles (sEVs).

-
A, BTransmission electron microscopy image (A) and the size distribution (B) of sEVs from the plasma of healthy individuals (left panel) and patients with gastric cancer (right panel). Scale bar = 200 nm.
-
CExpression levels of LSD1, CD63, and CD9 in sEVs with indicated treatment.
-
DCorrelation between the amount of LSD1‐containing sEVs and SOX2 in tissues of 10 patients used to isolate sEVs (Pearson’s test).
-
ERepresentative images are shown as indicated. Scale bar = 50 µm.
Source data are available online for this figure.
