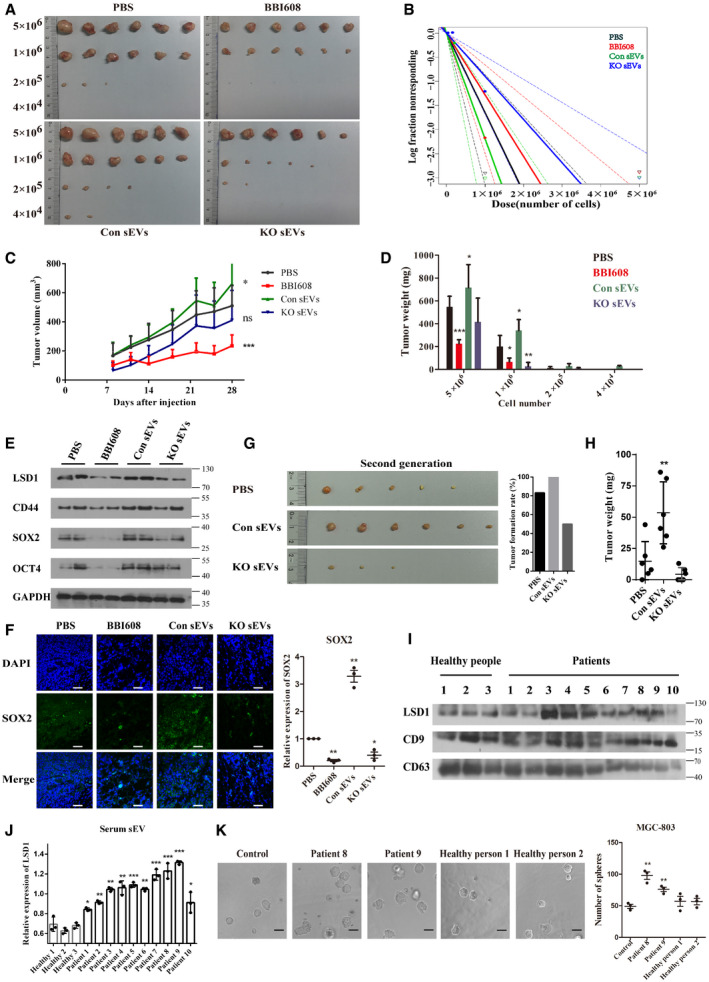
Figure 5. LSD1‐containing small extracellular vesicles (sEVs) promote gastric cancer cell stemness in vivo and clinical samples.

-
A, BIn vivo limiting dilution assay results of MGC‐803 cells treated with phosphate‐buffered saline, BBI608, sEVs from control cells (Con sEVs), and sEVs from LSD1 knockout (KO) cells (KO sEVs) as indicated for 28 days in BALB/c‐nu mice. Representative images of tumors excised from the mice (A) and the frequency of tumor formation (B) are shown (the solid line represents the sphere formation ability curve, while the dashed line represents the 95% confidence interval. The circles and triangles represent data from different groups).
-
CTumor volume of each group subjected to in vivo limiting dilution assay with 5 × 10⁶ cells with indicated treatment (n = 6 biological replicates; mean ± standard error of mean (SEM), *P = 0.0441 and ***P = 0.0002; two‐tailed unpaired Student’s t‐test).
-
DTumor weight of each group subjected to in vivo limiting dilution assay (n = 6 biological replicates; mean ± SEM; ***P < 0.0001, *P = 0.0285, *P = 0.0162, *P = 0.0498, and *P = 0.0049; two‐tailed unpaired Student’s t‐test).
-
EExpression levels of LSD1, CD44, SOX2, and OCT4 in tumor tissues subjected to in vivo limiting dilution assay performed with 5 × 10⁶ cells.
-
FImmunofluorescence image and quantification of the expression of SOX2 in tumor tissues subjected to in vivo limiting dilution assay. Scale bar = 50 µm (n = 3 biological replicates; mean ± SEM; **P = 0.0024, **P = 0.0088, and *P = 0.0342; two‐tailed unpaired Student’s t‐test).
-
GRepresentative images of second‐generation tumors (left) and the tumor formation rate (right) in each group.
-
HSecond‐generation tumor weight in each group (n = 6 biological replicates; mean ± SEM; *P = 0.0091; two‐tailed unpaired Student’s t‐test).
-
I, JExpression levels of LSD1 in sEVs isolated from the plasma. CD9 and CD63 were used as markers of sEVs. CD9 was used as a loading control for sEV lysis (n = 3 biological replicates; mean ± SEM; *P = 0.0256 (patient 1), **P = 0.0068 (patient 2), **P = 0.0013 (patient 3), **P = 0.0031 (patient 4), ***P = 0.0009 (patient 5), **P = 0.0012 (patient 6), ***P = 0.0007 (patient 7), ***P = 0.0010 (patient 8), ***P = 0.0001 (patient 9), and *P = 0.0461 (patient 10); two‐tailed unpaired Student’s t‐test).
-
KSphere formation assay results of MGC‐803 cells treated with sEVs as indicated for 7 days. Scale bar = 100 µm (n = 3 biological replicates; mean ± SEM; **P = 0.0019 and **P = 0.0050; two‐tailed unpaired Student’s t‐test).
Source data are available online for this figure.
