-
A
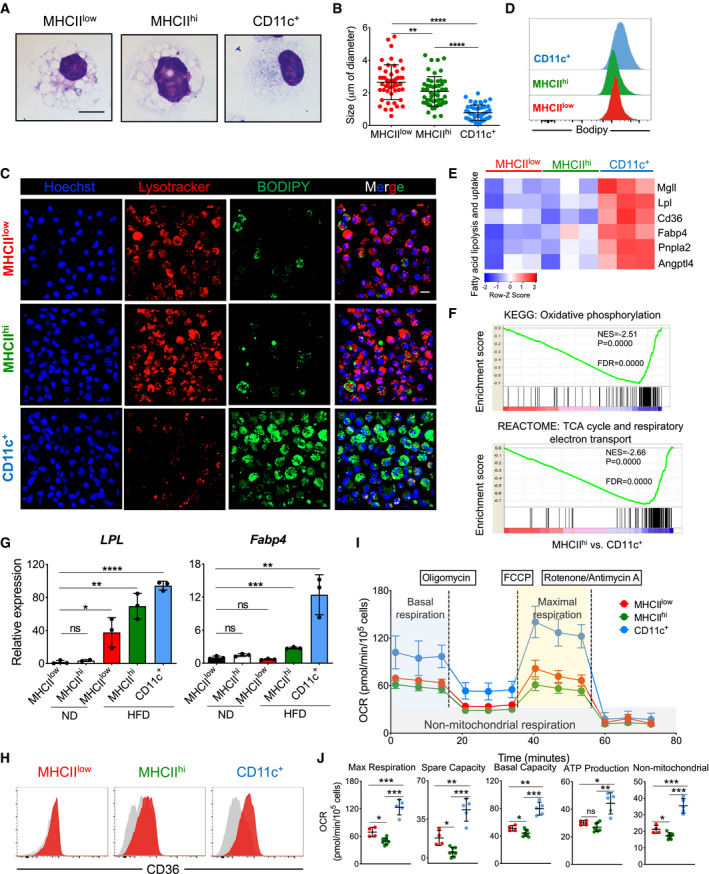
Representative Giemsa staining of sorted ATM subsets (MHCIIlow, MHCIIhi, and CD11c+) from obese (HFD 16 weeks) eWAT. Scale bar, 10 μm.
-
B
Quantification of intracellular vacuole sizes in the three different ATM subsets (n = 4 mice). The average size is presented as mean ± SD. Statistical significance was determined using one‐way ANOVA test. **P < 0.01 and ****P < 0.0001.
-
C
Representative confocal 3D images of LysoTracker‐stained (red), DAPI‐stained (blue), and BODIPY‐stained (green) ATM subsets obtained from eWAT of HFD (16 weeks) treated mice (n = 8 mice from two independent experiments). The merged figures are the result of the overlap of all three fluorochromes. Scale bar, 10 μm.
-
D
Representative histograms showing the mean fluorescence intensity of BODIPY‐stained ATM subsets obtained from obese (HFD 16 weeks) eWAT (n = 4 mice).
-
E
Heatmap showing fatty acid lipolysis‐ and uptake‐related genes differentially expressed among the eWAT ATM subsets from HFD‐treated (16 weeks) mice. Each cluster has three biological replicates. The z‐score of the gene expression profiles gives a scale to measure the differential expression.
-
F
Gene set enrichment analysis (GSEA) identified significant transcriptional upregulation in oxidative phosphorylation and the TCA cycle/respiratory electron transport signaling pathway in CD11c+ ATMs when compared with MHCIIhi ATMs obtained from eWAT of HFD‐treated (HFD 16 weeks) mice. Gene ontology (GO)/Kyoto Encyclopedia of Genes and Genomes (KEGG) with false discovery rate (FDR) < 0.05.
-
G
qPCR validation of Lpl and Fabp4 expression in sorted ATM subsets from eWAT of ND‐ and HFD‐treated (16 weeks) mice (n = 3 of 5 pooled mice each). Data are presented as mean ± SD. *P < 0.05; **P < 0.01, ***P < 0.001; and ****P < 0.0001. ns: no significant difference.
-
H
Representative FACS analysis of CD36 expression in ATM subsets from eWAT of HFD (16 weeks) mice (n = 4 mice).
-
I, J
Mito Stress assay of sorted ATM subsets (red, MHCIIlow; green, MHCIIhi; and blue, CD11c+) from 16‐week HFD obese mice showing overall oxygen consumption rate (OCR), maximal respiration, spare capacity respiration, basal respiration, ATP production, and non‐mitochondrial respiration. OCR data shown are representative of four independent experiments and expressed as mean ± SD (n = 4 MHCIIlow; n = 7 MHCIIhi; n = 5 CD11c+), with statistical significance determined using one‐way ANOVA test (*P < 0.05; **P < 0.01; and ***P < 0.001. ns: no significant difference).

