
Figure EV2. Dot plots of 10 marker genes for each major cell population of lean and obese eWAT related to Fig 5B .
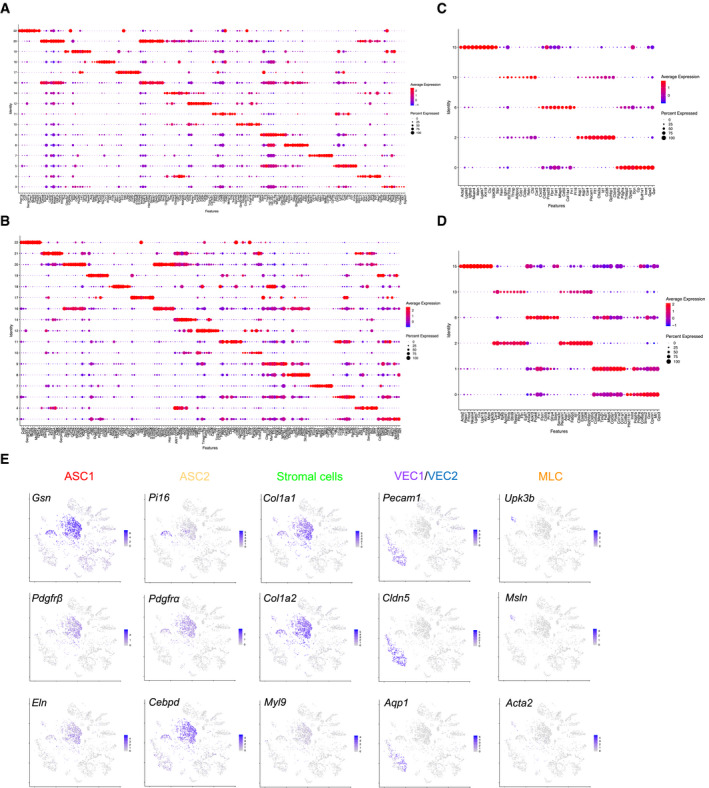
- Marker genes of CD45+ clusters in lean eWAT.
- Marker genes of CD45+ clusters in obese (HFD 16 weeks) eWAT.
- Marker genes of CD45− clusters in lean eWAT.
- Marker genes of CD45− clusters in obese (HFD 16 weeks) eWAT. The average expression level is indicated by the color, and the percentage is indicated by the size of circle.
- Feature plots of selected maker genes of CD45− clusters related to Fig 5C. The color of the cells represents their level of expression.