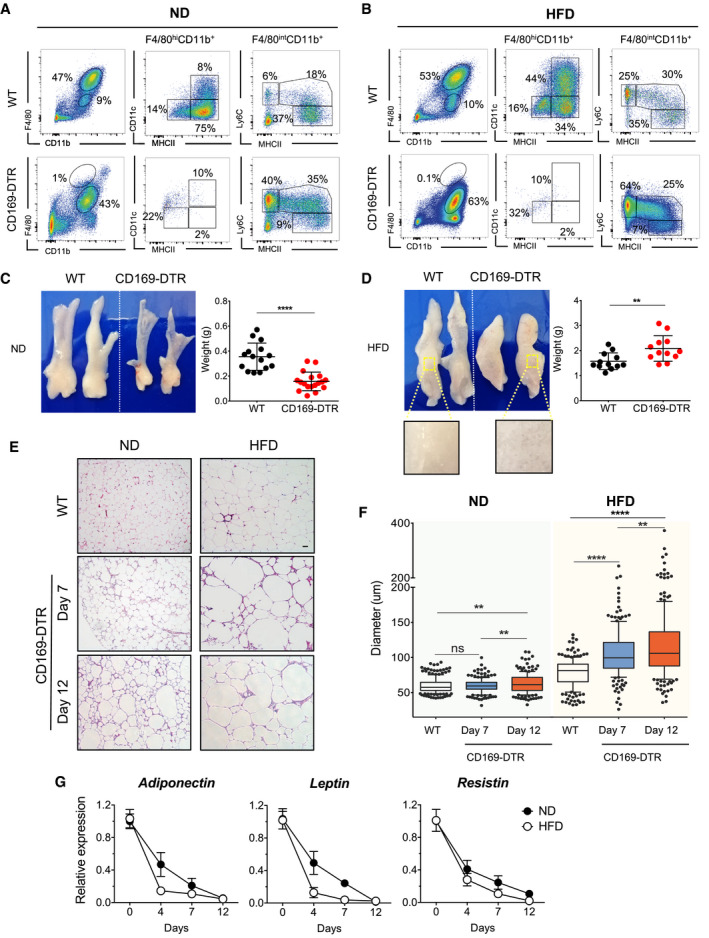
Figure 3. ATM‐depleted CD169‐DTR mice show increased hypertrophic and dysfunctional adipocytes.

-
A, BRepresentative flow cytometric showing the specific depletion efficiency of ATM subsets from eWAT of CD169‐DTR ND‐ (A) or HFD‐treated (16 weeks) (B) mice. A representative analysis of three independent experiments is shown.
-
C, DeWAT was collected from lean (C) and obese (HFD 16 weeks) (D) WT or CD169‐DTR mice after 12 days of DT‐mediated ATM depletion. Representative pictures of dissected eWAT are shown on the left and the corresponding eWAT weights expressed as mean ± SD of more than 12 samples are shown in the right, with statistical significance calculated using Student’s t‐test (**P < 0.01 and ****P < 0.0001). The zoomed‐in area shows clear, oily lipid accumulation in the absence of ATMs (lower left part).
-
E, FAdipocyte hypertrophy is visible in the absence of ATMs. Representative images of hematoxylin and eosin staining (H&E) (E) and corresponding adipocyte diameters (F) of lean and obese (HFD 16 weeks) eWAT from WT or CD169‐DTR mice treated for 7 or 12 days with DT. Scale bar, 50 μm. Each group comprised 3–5 mice. Statistical significance was determined using one‐way ANOVA test. **P < 0.01 and ****P < 0.0001. ns: no significant difference. The box and whisker plots show the median value and 10–90 percentiles of adipocyte diameters.
-
GRelative expression of adipokines (adiponectin, leptin, and resistin) in eWAT obtained from WT or CD169‐DTR mice, as measured by qPCR after 4, 7, and 12 days of DT treatment. Black circles, ND‐fed mice and white circles, HFD‐fed (16 weeks) mice (n ≥ 5 mice per group, mean ± SD).
