
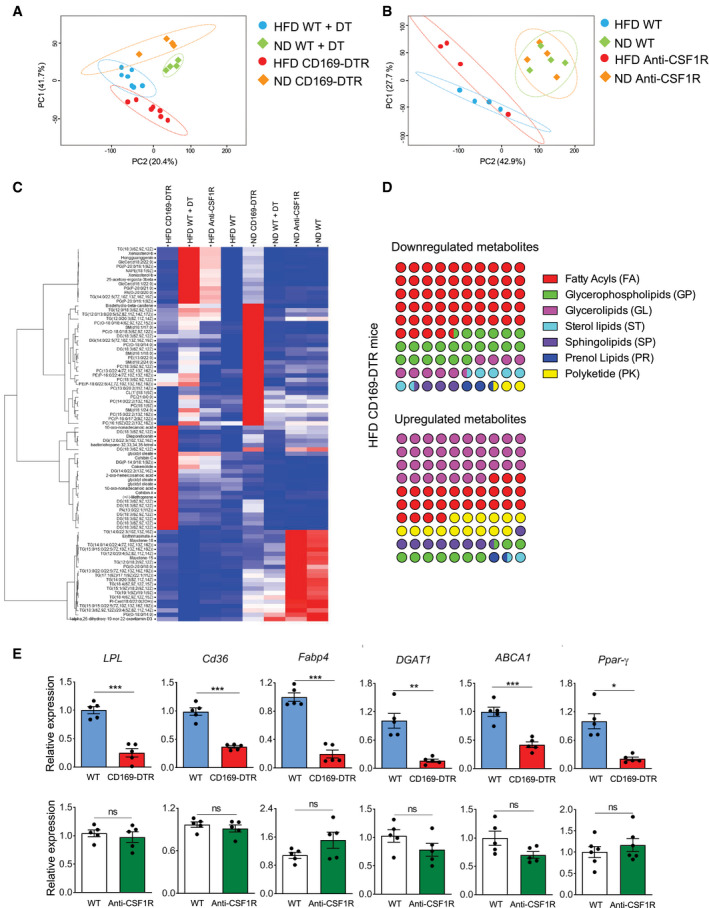
Figure 4. Perturbed lipid metabolism in eWAT in the absence of CD169+ ATMs.
-
A, B2D PCA plots showing distinct lipid metabolite profiles of lean (square) and obese (round, HFD 16 weeks) WT (light green and light blue) and CD169‐DTR (A) or anti‐CSF1R antibody‐injected (B) (red and orange) mice. Mice were under DT or anti‐CSF1R antibody treatment for 12 days.
-
CHierarchical clustering heatmap showing the major changes in lipid metabolites in eWAT among the ND or HFD (16 weeks) CD169‐DTR or anti‐CSF1R antibody‐treated groups.
-
DDot plots showing the percentage of perturbed lipid categories (fold change >2) in HFD (16 weeks) CD169‐DTR mice. Upregulated (left) or downregulated (right) lipid metabolites between HFD (16 weeks) WT and CD169‐DTR mice were classified into their lipid categories according to the LIPID MAPS Structure Database (https://www.lipidmaps.org/data/classification/LM_classification_exp.php).
-
EqPCR showing the relative expression of genes for adipogenesis (Pparγ), lipolysis (Lpl), and lipogenesis (Dgat1), plus other lipid receptor/transporters (Cd36, Abca1) or chaperones (Fabp4) in obese (HFD 16 weeks) eWAT of CD169‐DTR (red bars) mice and DT‐injected WT controls (blue bars) (upper panel) and obese eWAT of anti‐CSF1R antibody‐injected mice (green bars) mice and isotype control‐injected WT controls (white bars) (lower panel). Mice were under DT or anti‐CSF1R antibody treatment for 12 days. (n = 5 pooled mice per group, mean ± SD). Statistical significance was determined using an unpaired Student’s t‐test. *P < 0.05, **P < 0.01, and ***P < 0.001. ns: no significant difference.