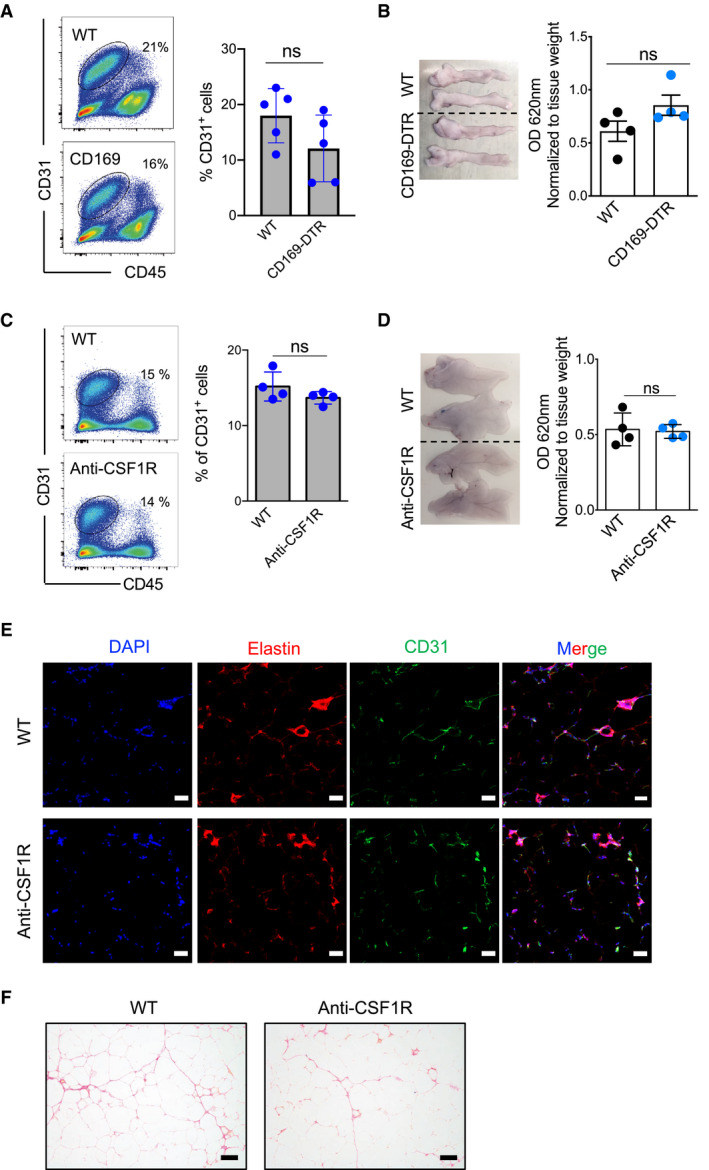
Representative flow cytometry analysis (on the left) shows the staining profile of CD45 and CD31, and the chart (on the right) shows the percentage of CD31+CD45− fractions in the eWAT (ND 16 weeks) of five male control and five male CD169‐DTR (DT for 7 days) mice; data were expressed as mean ± SD. Statistical significance was determined using an unpaired Student’s t‐test. ns: no significant difference.
Left: Representative Evans blue‐stained eWAT pictures obtained from WT or CD169‐DTR male mice (ND 16 weeks, DT for 7 days). Right: The chart shows the normalized (absorption values were normalized to tissue weight in grams) mean optical density ± SD (n = 4 mice per group). Statistical significance was determined using an unpaired Student’s t‐test. ns: no significant difference.
Representative flow cytometry analysis (on the left) shows the staining profile of CD45 (x‐axis) and CD31 (y‐axis), and the chart (on the right) shows the percentage of CD31+ CD45− fractions in the eWAT (HFD 16 weeks) of 4 control and 4 anti‐CSF1R antibody‐treated mice; data were expressed as mean ± SD. Statistical significance was determined using an unpaired Student’s t‐test. ns: no significant difference.
Left: Representative Evans blue‐stained eWAT pictures from WT or anti‐CSF1R antibody‐treated mice (HFD 16 weeks, after 12 days’ antibody treatment). Right: The chart shows the normalized (absorption values were normalized to tissue weight in grams) mean optical density ± SD (n = 4 mice per group). Statistical significance was determined using an unpaired Student’s t‐test. ns: no significant difference.
Elastin staining showing similar ECM distribution in anti‐CSF1R antibody‐treated (HFD 16 weeks) mice compared with the ECM distribution in the control (DAPI, blue; elastin, red; and CD31, green). The final image shows the other images merged together (n = 3–5 mice per group). Scale bar: 50 μm.
Representative picrosirius red staining showing comparable collagen expression in anti‐CSF1R antibody‐treated eWAT (HFD 16 weeks) compared with collagen expression in WT control mice (n = 3–5 mice per group). Scale bar: 100 μm.

