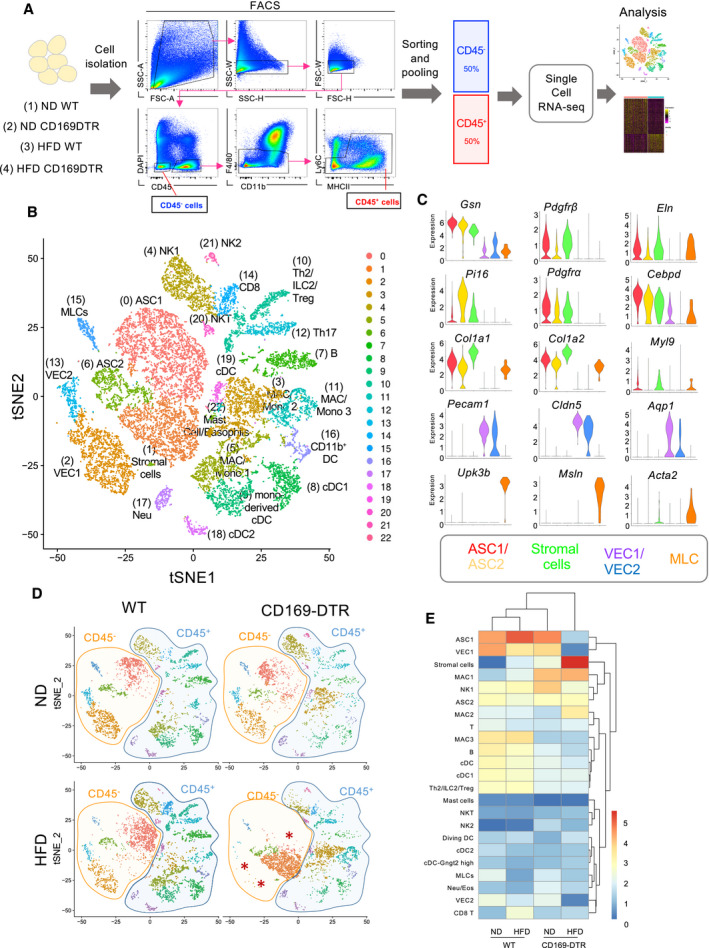
Schematic representation of the scRNA‐seq analysis used on a 1:1 mixture of CD45− and CD45+ eWAT cells (excluding F4/80hi resident macrophages and Ly6C+ monocytes) obtained from lean/obese (HFD 16 weeks) WT and CD169‐DTR mice (7 days DT injected, n = 5–8 mice per group).
t‐SNE projection of 18,798 pooled cells (5,032 cells from ND WT mice, 3,494 cells from ND CD169‐DTR mice, 5,096 cells from HFD (16 weeks) WT mice, and 5,176 cells from HFD (16 weeks) CD169‐DTR mice) isolated from eWAT of lean and obese WT/CD169‐DTR mice. The projection shows 23 distinct clusters of CD45− and CD45+ cell populations identified via unsupervised clustering. Six specific CD45− cell clusters were identified, including adipocyte stem cells (ASC1 and ASC2), stromal cells, vascular endothelial cells (VEC1 and VEC2), and mesothelial‐like cells (MLCs). Seventeen different CD45+ cell clusters were identified, including B and T cells, NK cells, and several myeloid subpopulations. NK: natural killer; MAC: macrophage; Mono: monocyte; DC: dendritic cell; and NKT: natural killer T.
Violin plots depicting the expression of representative marker genes for each CD45− cell cluster: ASC1 (Gsn, Pdgfrb, Eln) (red), ASC2 (Pi16, Pdgfra, Cebpd) (yellow), stromal cells (Col1a1, Col1a2, Myl9) (green), VEC1/VEC2 (Pecam‐1, Cldn5, Aqp1) (purple and blue), and mesothelial‐like cells (MLCs) (Upk3b, Msln, Acta2) (orange).
Four t‐SNE plots of 5,032, 3,494, 5,096, and 5,176 cells obtained from lean/obese WT and CD169‐DTR mice. Orange and blue shaded areas depict the CD45− and CD45+ cell clusters, respectively.
Hierarchical heatmap showing the percentage (log2) of all 23 cell clusters identified in lean/obese (HFD 16 weeks) WT and CD169‐DTR mice.

