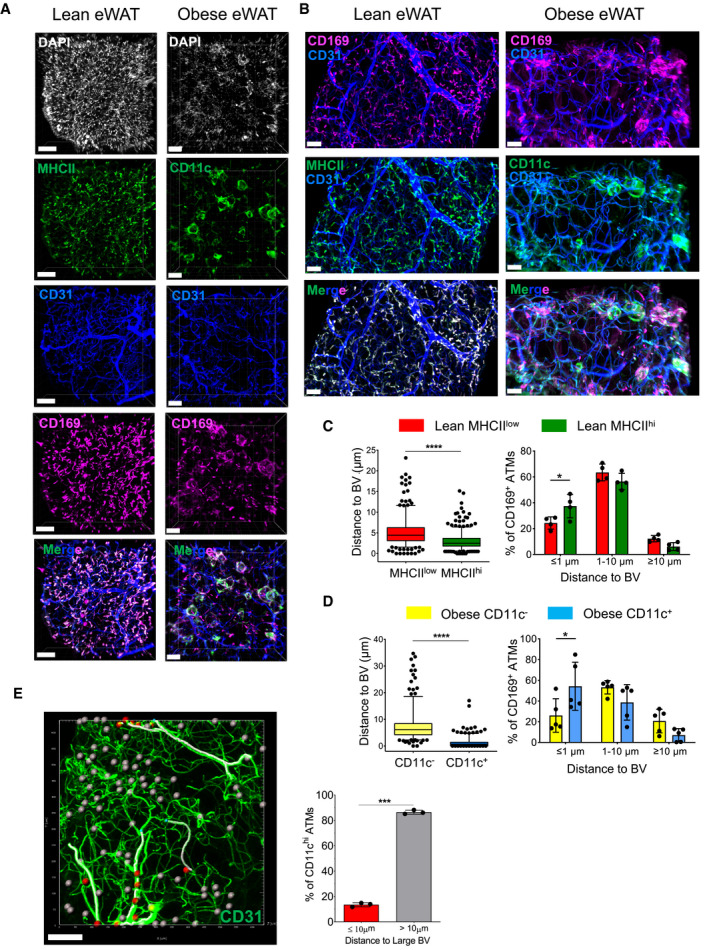
Figure 6. CD169+ ATMs are closely associated with the eWAT vasculature.

-
ARepresentative 3D fluorescence imaging of lean and obese (HFD 16 weeks) eWAT samples stained with anti‐MHCII (green in lean samples), anti‐CD11c (green in obese samples), anti‐CD31 (blue), anti‐CD169 (pink), and DAPI (white). The two images at the bottom show the images merged for the lean and obese conditions without DAPI. Scale bar: 100 µm (lean) and 70 µm (obese).
-
BHigher magnification of specific eWAT areas. Scale bar: 30 µm (lean) and 50 µm (obese).
-
C, D(left panels) Distance of different ATM subsets to blood vessels. Distances (in µm) were calculated using the Imaris software, as described in the Materials and Methods section. The box and whisker plots show the median value and 10‐90 percentiles of distance values. The right panels show the distribution of ATM subsets to blood vessels within a certain distance (≤ 1 μm, 1–10 μm, ≥ 10 μm). C: CD169+MHCIIlow and CD169+MHChi ATMs in lean eWAT. D: CD169+CD11c− and CD169+CD11c+ ATMs in obese (HFD 16 weeks) eWAT. Four mice from two independent experiments were analyzed (n = 4–5; mean ± SD). Statistical significance was determined using an unpaired Student’s t‐test. *P < 0.05 and ****P < 0.0001, bars with no asterisks showed no significant difference.
-
EModel construction based on 3D reconstructed images showing the relative distance of CD11c+ ATMs from traced large blood vessels. Blood vessels larger than 10µm diameter in the image were marked out on the image by tracing (white filaments). CD11c+ ATMs are close (< 10 µm) to the traced large blood vessels (red ellipsoids) or far (> 10 µm) (gray ellipsoids) from the traced blood vessel. Blood vessels are shown in green. Scale bar: 100 μm. The graph to the right shows the percentage of CD11chi ATMs showing a proximity of ≤ 10 or >10 µm to blood vessels quantified from 3 biological replicates from 1 experiment, and data were expressed as mean ± SD. Statistical significance was determined using an unpaired Student’s t‐test. ***P < 0.001.
