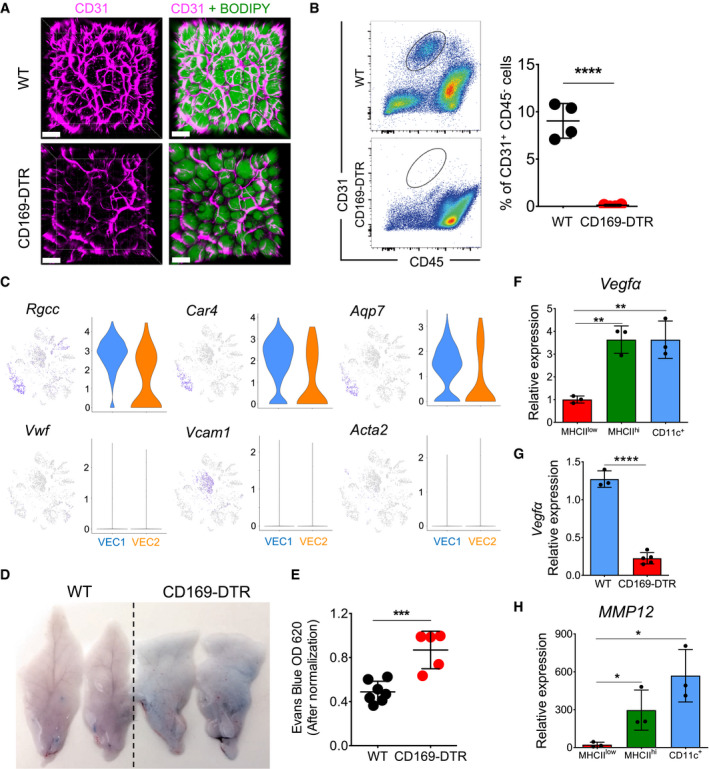
Figure 7. Vascular integrity is impaired in eWAT that lacks ATMs.

-
ARepresentative 3D fluorescence imaging of obese (HFD 16 weeks) eWAT stained with BODIPY (green) and anti‐CD31 (pink) obtained from WT and CD169‐DTR mice treated with DT over 7 days. Scale bar, 100 μm.
-
BThe lack of a CD31+ fraction after cell isolation from eWAT obtained from obese (HFD 16 weeks) CD169‐DTR mice following ablation of ATMs for 7 consecutive days. The flow cytometry analysis (on the left) shows the staining profile of CD45 (x‐axis) and CD31 (y‐axis), and the chart (on the right) shows the percentage of CD31+ CD45− fractions in the eWAT of control and CD169‐DTR mice (both n = 4); data were expressed as mean ± SD. Statistical significance was determined using an unpaired Student’s t‐test. ****P < 0.0001.
-
CViolin and feature plots of single cells in the VEC1 and VEC2 clusters showing expression of typical marker genes for capillaries or arteries (Rgcc, Car4, Acq7) and veins (Vwf, Vcam1, Acta2) in WT obese (HFD 16 weeks) eWAT.
-
D, EVascular permeability is increased in eWAT obtained from obese (HFD 16 weeks) CD169‐DTR mice. (D) Two representative images of eWAT dissected from Evans blue‐injected obese (HFD 16 weeks) WT and CD169‐DTR mice treated for 7 days with DT. Evans blue dye was extracted from eWAT using formamide, and the absorption of the extract was measured at 620 nm (the absorption values were normalized to the tissue weight in grams). (E) A chart showing the normalized mean optical density ± SD (n = 5–7 mice per group). Statistical significance was determined using an unpaired Student’s t‐test. ***P < 0.001.
-
F–HMmp12 (H) and Vegfα (F) are highly expressed in MHCIIhi and CD11c+ ATMs purified from obese (HFD 16 weeks) eWAT. qPCR analysis showed the relative expression in all three ATM subsets (n = 3), and data were expressed as mean ± SD. Statistical significance between the three ATM subpopulations was determined using one‐way ANOVA test. *P < 0.05 and **P < 0.01. (G) qPCR analysis showing the relative expression of Vegfα in obese (HFD 16 weeks) eWAT of WT (n = 3) or CD169‐DTR mice (n = 5) treated for 7 days with DT; data were expressed as mean ± SD. Statistical significance was determined using an unpaired Student’s t‐test. ****P < 0.0001.
