-
A
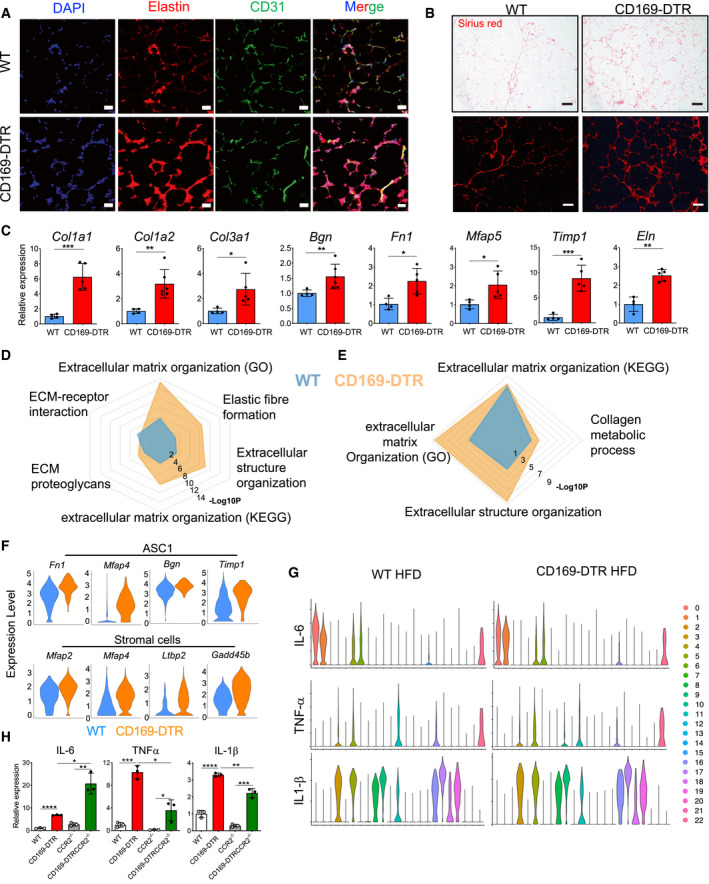
Elastin staining showing more pronounced ECM accumulation in eWAT of CD169‐DTR (HFD 16 weeks) when compared with ECM accumulation in the WT obese (HFD 16 weeks) control (DAPI, blue; elastin, red; and CD31, green). The fourth image in each row shows the three channels merged. Scale bar: 50 μm.
-
B
Picrosirius red staining depicts excessive collagen deposits in obese (HFD 16 weeks) eWAT of CD169‐DTR mice when compared with collagen deposits in WT controls. Scale bar: 250 μm. Upper panels: brightfield microscopy and lower panels: fluorescence microscopy.
-
C
qPCR analysis showing the relative expression of ECM marker genes in obese (HFD 16 weeks) eWAT of WT (blue bars) and CD169‐DTR (red bars) mice (DT treatment for 7 days). n = 4–6 mice per group, data were expressed as mean ± SD. Statistical significance was determined using an unpaired Student’s t‐test. *P < 0.05, **P < 0.01, and ***P < 0.001.
-
D, E
Common signaling pathways of single cells from clusters of ASC1 (D) and stromal cells (E) showed increased ECM remodeling pathways in HFD (16 weeks) CD169‐DTR mice when compared to WT mice.
-
F
Violin plots of single cells showing upregulated ECM gene signatures in ASC1 (top, Fn1, Mfap4, Bgn, and Timp1) and stromal cell clusters (bottom, Mfap2, Mfap4, Ltbp2, and Gadd45b) in eWAT of obese (HFD 16 weeks) CD169‐DTR mice when compared with the expression of these genes in WT mice.
-
G
Violin plots showing the pro‐inflammatory cytokine profile (Il‐6, Tnf‐α, and Il‐1β) of all 23 cell clusters obtained from obese (HFD 16 weeks) WT and CD169‐DTR eWAT. Cluster 0: ASC1; Cluster 1: stromal cells; Cluster 2: VEC1; Cluster 3: VEC2; Cluster 4: NK1; Cluster 5: MAC/Mono1; Cluster 6: ASC2; Cluster 7: B; Cluster 8: cDC1; Cluster 9: mono‐derived cDC; Cluster 10: Th2/ILC2/Treg; Cluster 11: MAC/Mono3; Cluster 12: Th17; Cluster 13: VEC2; Cluster 14: CD8; Cluster 15: MLCs; Cluster 16: CD11b+ DC; Cluster 17: neutrophils; Cluster 18: cDC2; Cluster 19: cDC; Cluster 20: NKT; Cluster 21: NK2; and Cluster 22: mast cells/basophils. ASC: adipocyte stem cell; VEC: vascular endothelial cell; MLC: mesothelial‐like cell; NK: natural killer; MAC: macrophage; Mono: monocyte; DC: dendritic cell; and NKT: natural killer T cells.
-
H
qPCR analysis showing the relative expression of Il‐6, TnF‐α, and Il‐1β in obese (HFD 16 weeks) eWAT collected from WT, CD169‐DTR, CCR2−/−, and CCR2−/− CD169‐DTR mice (n = 3); data were expressed as mean ± SD. Statistical significance between the four experimental groups was determined using a Bonferroni two‐way ANOVA test. *P < 0.05; **P < 0.01; ***P < 0.001; and ****P < 0.0001.

