
FIGURE 2.
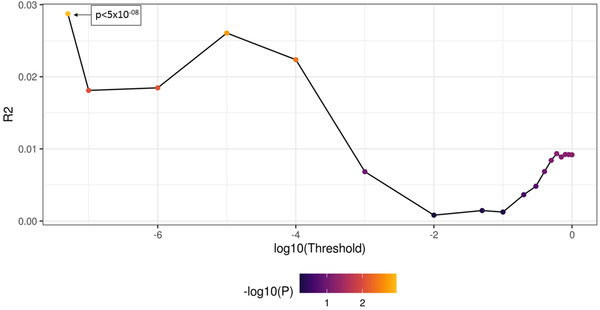
Line plot depicting the thresholding of single nucleotide polymorphisms. Each dot represents a different thresholding window. Best threshold in this case was at P < 5 × 10–08
Official websites use .gov
A
.gov website belongs to an official
government organization in the United States.
Secure .gov websites use HTTPS
A lock (
) or https:// means you've safely
connected to the .gov website. Share sensitive
information only on official, secure websites.
Line plot depicting the thresholding of single nucleotide polymorphisms. Each dot represents a different thresholding window. Best threshold in this case was at P < 5 × 10–08