FIGURE 3.

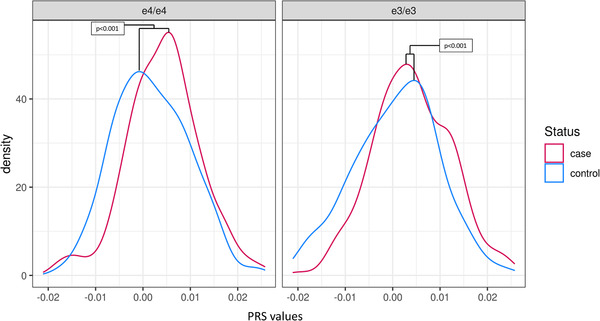
Density plot showing the difference in polygenic risk score distribution in cases and controls in the apolipoprotein E (APOE) ε4/ε4 extremes and APOE ε3/ε3 extremes

Density plot showing the difference in polygenic risk score distribution in cases and controls in the apolipoprotein E (APOE) ε4/ε4 extremes and APOE ε3/ε3 extremes