
Figure EV1. Characterization of the NK cell killing assay.
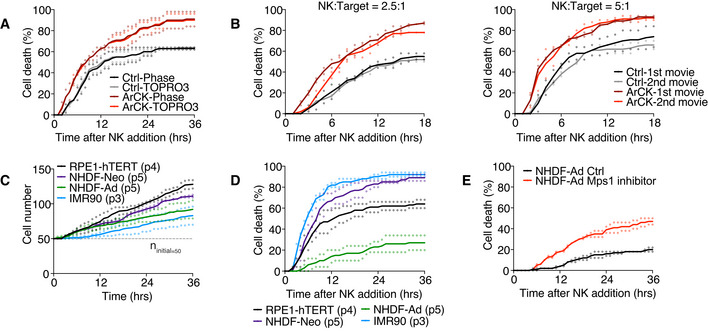
- Side‐by‐side comparison analyzing NK cell‐mediated killing on euploid control or ArCK cells by phase contrast image (Phase) or TO‐PRO3 signal. Cells were cultured as described in Fig 1A. Statistical analyses were performed as in Fig 1C. Individual points and mean were presented; n = 2 biological replicates. Ctrl‐Phase vs. Ctrl‐TOPRO3, P = 0.89, n.s.; ArCK‐Phase vs. ArCK‐TOPRO3, P = 0.89, n.s.; KS test.
- Measurement of NK cell‐mediated killing of ArCK cells in two consecutive 18‐h time lapse experiments. After the first 18 h of the analysis, the cell suspension was collected and co‐cultured with a second set of target cells. NK cell‐mediated killing was measured in the first (black and dark red curves) and the second (gray and light red curves) 18‐h time lapse and plotted on the same graph. The killing assay was performed at a NK cell‐to‐target cell ratio of 2.5:1 (left panel) and 5:1 (right panel); n = 2 biological replicates. NK:Target = 2.5:1, Ctrl‐1st movie vs. Ctrl‐2nd movie, P = 1.00, n.s.; ArCK‐1st movie vs. ArCK‐2nd movie, P = 0.21, n.s.; NK:Target = 5:1, Ctrl‐1st movie vs. Ctrl‐2nd movie, P = 0.28, n.s.; ArCK‐1st movie vs. ArCK‐2nd movie, P = 0.97, n.s.; KS test.
- Cell proliferation measurements in the absence of NK cells. RPE1‐hTERT (passage 4), human normal neonatal or adult human dermal fibroblasts (NHDF‐Neo, passage 5 or NHDF‐Ad, passage 5), and human embryonic lung fibroblast (IMR90, passage 3) were plated side by side in NK cell medium, and cell proliferation rate was recorded using live cell imaging as described in Fig 1D. The dashed line indicates the starting cell number (n initial = 50). Dot plot of individual data points and mean is shown; n = 2 biological replicates.
- NK cell‐mediated cytotoxicity across different cell types. The killing of RPE1‐hTERT, human normal neonatal or adult human dermal fibroblasts (NHDF‐Neo or NHDF‐Ad), and human embryonic lung fibroblast (IMR90) were measured as described in Fig 1 using a NK cell‐to‐target cell ratio of 2.5–1; n = 2 biological replicates. Individual data and mean are shown.
- Human normal adult dermal fibroblasts (NHDF‐Ad) were treated with either DMSO or the Mps1 inhibitor reversine (500 nM) for 24 h. Drugs were washed out, and NK cell‐mediated killing was compared between DMSO‐treated (NHDF‐Ad Ctrl) and Mps1 inhibitor‐treated (NHDF‐Ad Mps1 inhibitor) cells as described in Fig 1C; n = 2 biological replicates. NHDF‐Ad Ctrl vs. NHDF‐Ad Mps1 inhibitor, P = 0.001; KS test.