
Figure EV2. Characterization of aneuploid‐ and G1‐arrested cells.
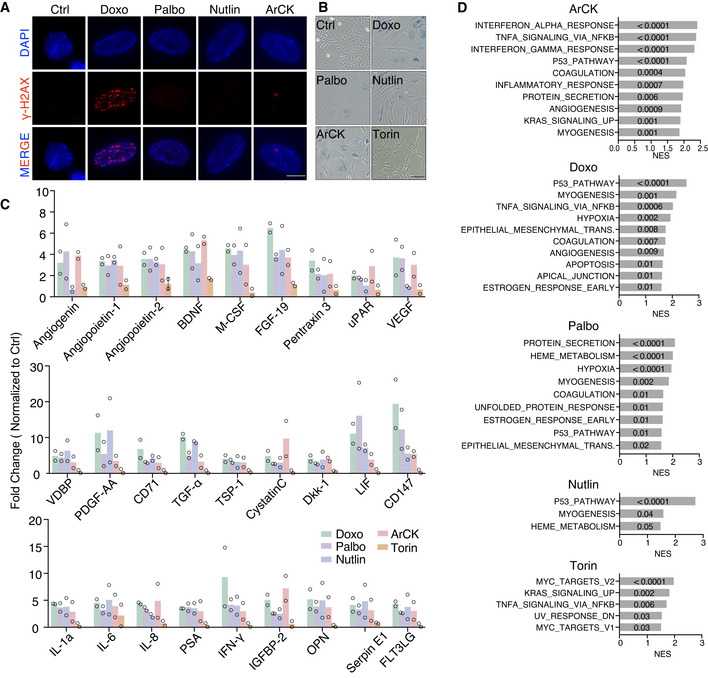
- Representative images of γ‐H2AX staining in the indicated samples. γ‐H2AX is in red and DNA in blue. Scale bar 10 μm.
- Representative image of senescence‐associated β‐galactosidase staining in the indicated samples. Scale bar 100 μm.
- Analysis of all cytokines secreted by the indicated cells. Cytokine levels are shown as fold change in euploid control cells; n = 2 biological replicates. Individual values and mean are plotted.
- Gene set enrichment analysis (GSEA) for doxorubicin‐treated (Doxo), palbociclib‐treated (Palbo), nutlin3‐treated (Nutlin), torin1‐treated (Torin) and ArCK cells relative to euploid proliferating control cells. Only the top 10 ranked hallmarks are presented in Doxo, Palbo, and ArCK conditions. The normalized enrichment score (NES) is plotted. The numbers on the NES score bar indicate the corresponding p‐values for each hallmark (FDR q value ≤ 0.05).