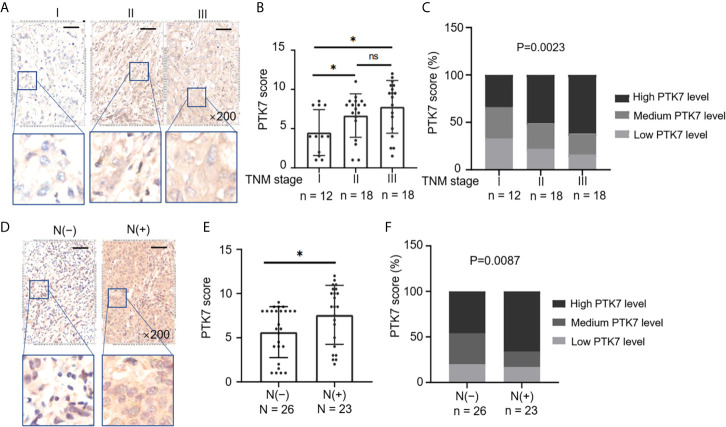
Figure 3.
Upregulation of PTK7 is related to metastasis and TNM stage in TNBC. (A) TNBC samples from 280 subjects of breast cancer tissue microarray were selected and divided into three groups based on TNM stages (AJCC staging). Representative images of IHC staining of PTK7 expression in the three groups (stage I, II and III) are shown. Magnification, ×200; scale bars, 100 μm. (B) Scatter dot plots of PTK7 scores in the three groups described in (A). Data were analyzed using one-way ANOVA and are shown as mean ± s.d. *P < 0.05. (C) The percentage of cases in the groups described in (A). Data were analyzed using Pearson’s χ 2 test. Light grey, low PTK7 level (IHC score 0~4); dark grey, medium PTK7 level (IHC score 5~8); black, high PTK7 level (IHC score 8~12). (D) TNBC samples were divided into two groups based on lymph node metastasis. Representative images of PTK7 staining in TNBC with or without lymph node metastasis are shown. Magnification, ×200; scale bars, 100 μm. (E) Scatter dot plots of PTK7 scores in the two groups described in (D). Data were analyzed using one-way ANOVA and are shown as mean ± s.d. *P < 0.05. (F) The percentage of cases in the groups described in (D). Data were analyzed using Pearson’s χ 2 test. Light grey, low PTK7 level (IHC score 0~4); dark grey, medium PTK7 level (IHC score 5~8); black, high PTK7 level (IHC score 8~12). ns, no significance.

