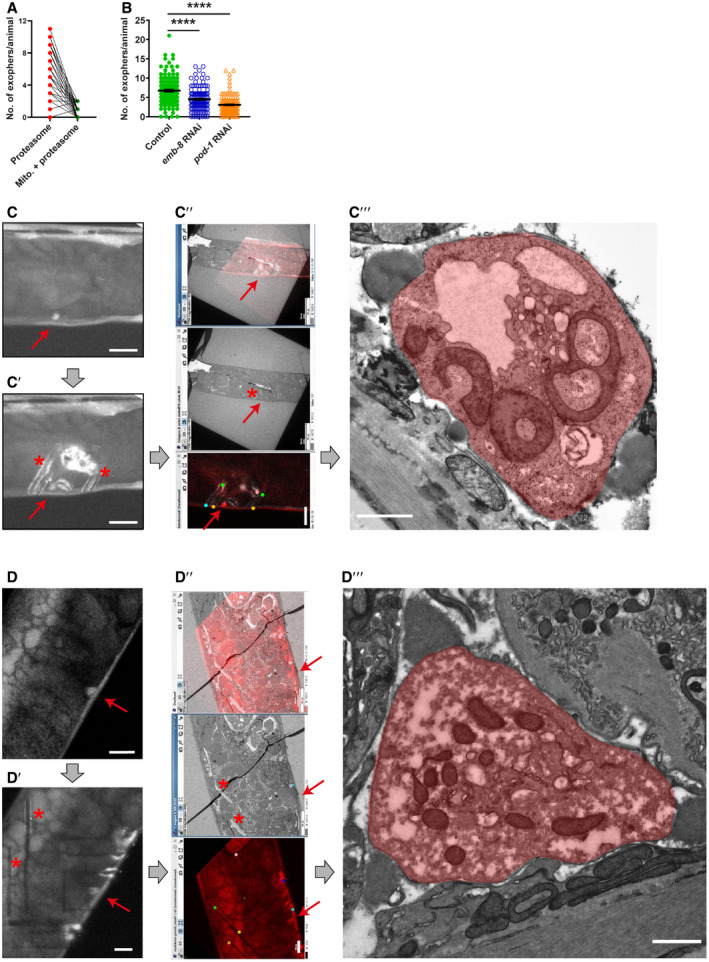
Figure EV1. Regulation and ultrastructure of muscular exophers.

-
ASmall fraction of muscular exophers contain mitochondria. n = 60; N = 6. n represents the number of worms; N represents the number of experimental repeats that were combined into a single value.
-
BThe formation of muscle‐derived exophers, like that of neuronal exophers, is affected by the depletion of EMB‐8 and POD‐1. n = 80–120; pod‐1 RNAi – N = 2, emb‐8 RNAi – N = 3. Data are shown as mean ± SEM; n represents the number of worms; N represents the number of experimental repeats combined into a single value; ****P < 0.0001, Mann–Whitney test.
-
C, DExophers visualization using correlative light electron microscopy (CLEM). Exopher's red fluorescence (red arrow). (C′, D′) Exopher (red arrow) surrounded by marks (asterisk) after NIRB, autofluorescence of branded frame edges is visible. (C″, D″) CLEM tracking the exopher—LM image, EM image, and their overlay. (C‴, D‴) Image shows exopher's (colored in red) ultrastructure.
Data information: Thick, gray arrows show an order of steps done for the final exopher detection under the electron microscope. Red arrows point to exophers; asterisks and colored points show landmarks after NIRB (Near Infra‐Red Branding), which are used for correlating fluorescence and electron microscopy pictures. Scale bars are: C–C′, D–D′, C″ (bottom picture), D″ (bottom picture)—10 μm; C″ (top and middle picture), D″ (top and middle picture)—50 μm; C‴, D‴—1 μm.
