
Figure EV2. Networking analysis of the AURKA proximity interactome.
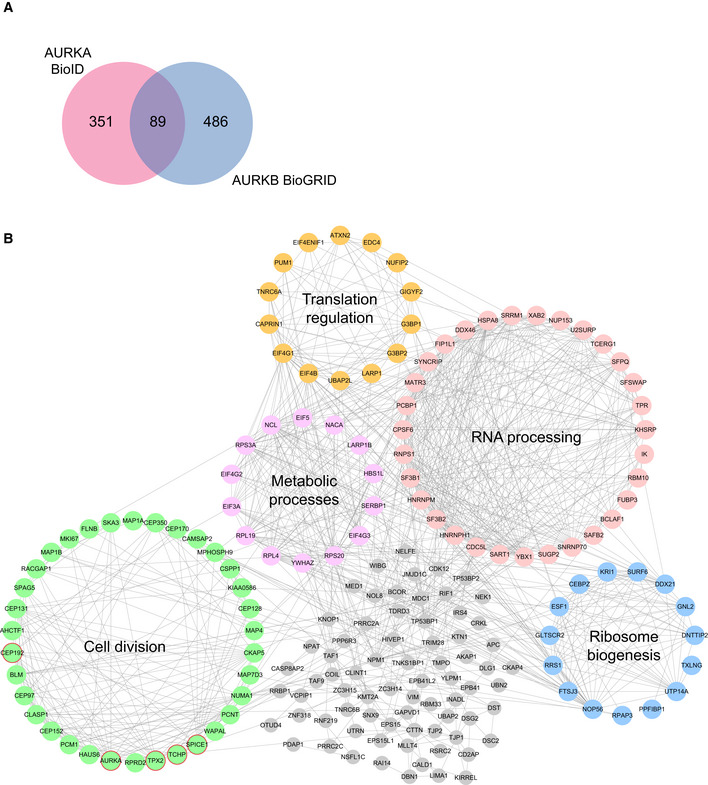
- Comparison of AURKA proximity interactome with Aurora Kinase B (AURKB) interactors derived from BioGRID. Pink circle indicates the AURKA proximity interactome, and blue circle indicates AURKB interactome.
- High‐confidence proximity interactors of AURKA were determined using SAINT analysis. AURKA proximity interactors were ranked by their fold change in the V5‐BirA*‐AURKA dataset relative to V5‐BirA*‐dataset. The first 200 proteins were visualized in CytoScape, and the functional clusters were determined by combining STRING analysis with the ClusterONE plug‐in. Five functional clusters were enriched in the interactome, which include cell cycle (green), RNA processing (pink), ribosome biogenesis (blue), translation regulation (yellow) metabolic processes (purple). Uncategorized interactors are shown in gray, and the published interactors are shown in red circles.