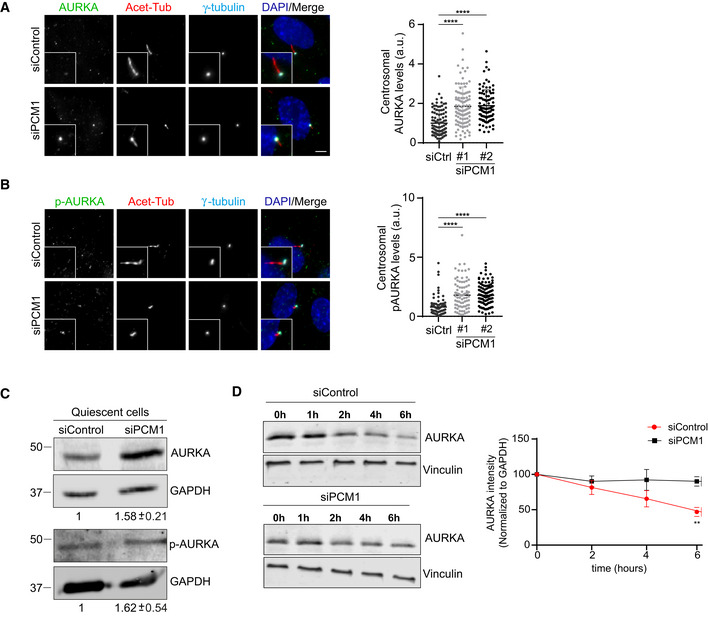
Figure 4. Centriolar satellites regulate AURKA localization, abundance, and activity in quiescent cells.

-
A, BRepresentative images and quantification of basal body levels of (A) AURKA and (B) phospho‐AURKA (p‐AURKA) in control and PCM1‐depleted cells. RPE1 cells were transfected with control or PCM1 siRNA #1 or siRNA #2 for 48 h. Following 24 h serum starvation, cells were fixed and stained with the indicated antibodies. Centrosomal AURKA and p‐AURKA fluorescence intensities were measured from maximum projections, and average means of the levels in control cells were normalized to 1. n > 500 cells per experiment. Data for (A) AURKA and (B) p‐AURKA represent mean value from three experiments per condition ± SEM (****P < 0.0001, unpaired Student's t‐test). Scale bar, 10 μm.
-
CTotal AURKA and p‐AURKA levels in control and PCM1‐depleted cells. RPE1 cells were transfected with control or PCM1 siRNA#1 for 48 h. Following 24 h serum starvation, cell lysates were prepared and run on an SDS–PAGE gel. Proteins were detected by immunoblotting with antibodies against AURKA, p‐AURKA, and GAPDH (loading control).
-
DCycloheximide chase experiment for quantification of AURKA half‐life. Cells were transfected with control or PCM1 siRNA#1 for 48 h and then treated with 200 nM cycloheximide along with serum starvation for indicated time points. AURKA intensities were quantified by immunoblotting for AURKA and vinculin (loading control) and AURKA levels were normalized to vinculin levels. Data represent mean value from three experiments per condition ± SEM (**P < 0.01, unpaired Student's t‐test).
