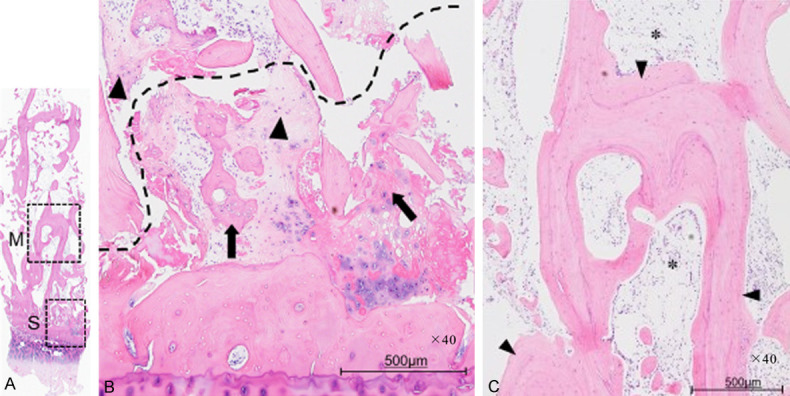
Figure 2.

A. A LOUPE image of the whole specimen (hematoxylin and eosin, ×1.25 magnification). Area “S” corresponds to the low intensity area on T1-weighted MRI. Area “M” corresponds to the lower intensity line on T1-weighted MRI. B. Photomicrograph of area “S” (hematoxylin and eosin, ×40 magnification, articular cartilage at the bottom, and bone marrow at the top). There is a fracture line (broken line) associated with a fracture callus (arrow) and reactive cartilage (arrowheads). C. Photomicrograph of area “M” (hematoxylin and eosin, ×40 magnification, articular cartilage at the bottom, and bone marrow at the top). Several thickened trabecular bones (arrowheads) are observed, and fibrovascular tissue is observed in the marrow space (asterisk).
