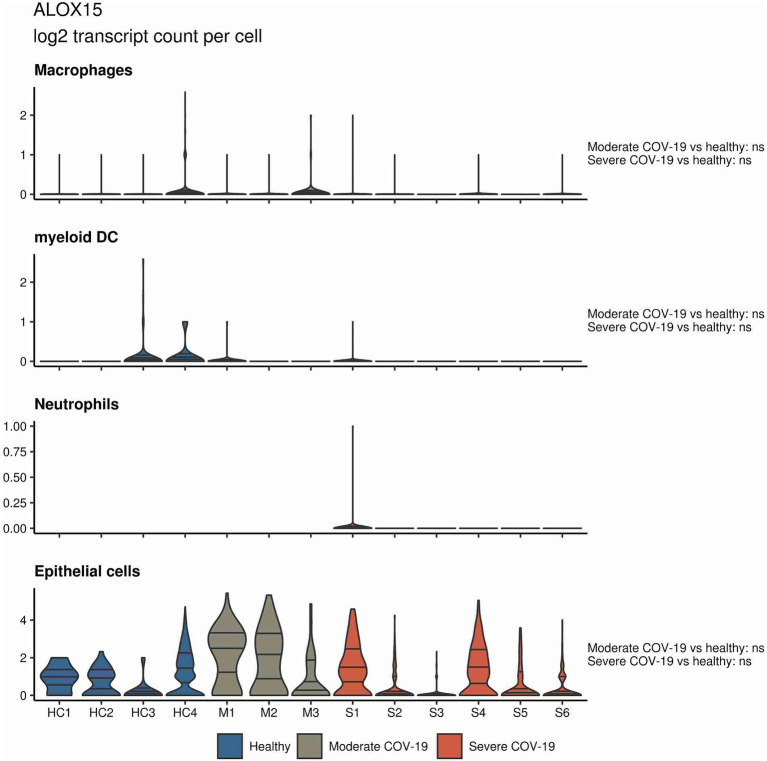
Figure 4.
ALOX15 expression in BALF cells from patients affected by COVID-19. Violin plots depicting ALOX15 expression levels within specific cellular populations in BALF cells from healthy (blue, n = 4), moderate (gray, n = 3), or severe (red, n = 6) COVID-19 patients. RNA sequencing data are publicly available (Liao et al., 2020). ns = non-significant.

