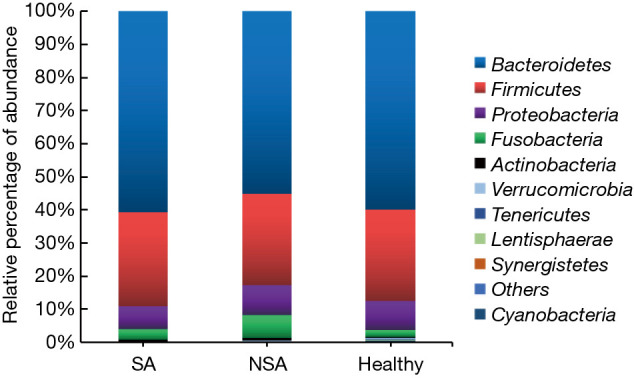
Figure 1.

Stacked bar chart showing bacterial composition (median values) at the phylum level in the subjects with severe asthma (SA), subjects with non-severe asthma (NSA), and healthy subjects. Bacteroidetes, Firmicutes, Fusobacteria, and Proteobacteria contributed over 90% of the total sequences in all three groups.
