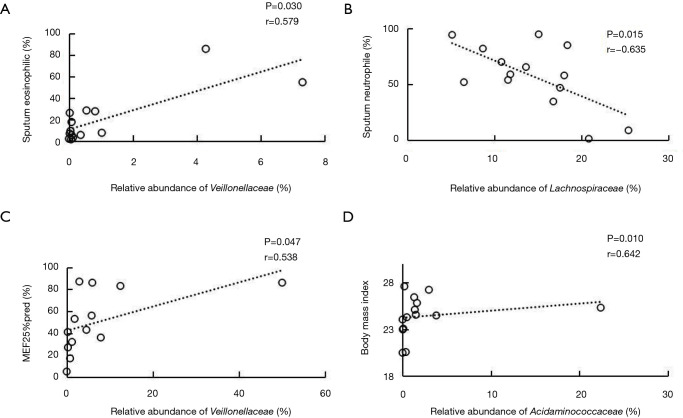
Figure 3.
Scatter plots and correlations. (A) Scatter plot of eosinophil count (%) in induced sputum and relative of Veillonellaceae in fecal samples of subjects from the non-severe asthma (NSA) group. (B) Scatter plot of neutrophil count (%) in induced sputum and relative abundance of Lachnospiraceae in fecal samples of subjects from the NSA group. (C) Scatter plot of mid-expiratory flow 25% (MEF25%) predicted (%) and relative abundance of Veillonellaceae in fecal samples of subjects from the severe asthma (SA) group. (D) Scatter plots of body mass index and relative abundance of Acidaminococcaceae in fecal samples of subjects from the SA group (Spearman’s rank correlation coefficient, P<0.05).

