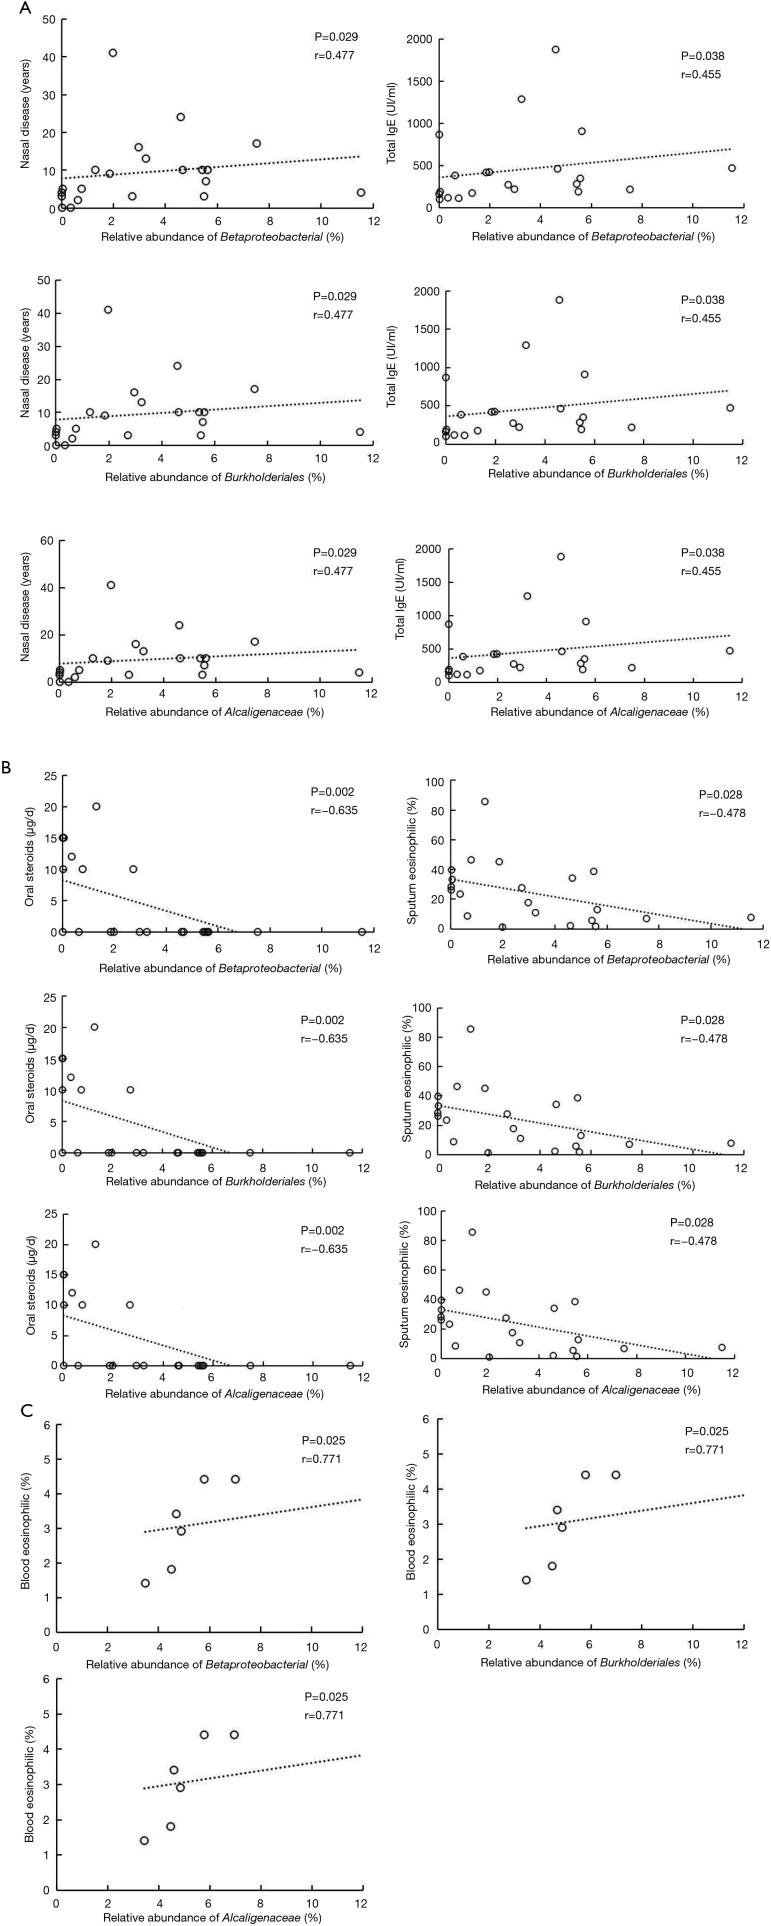
Figure 6.
Scatter plots and correlations. (A) Scatter plot of the relative abundance of Betaproteobacterial class, Burkholderiales order, and Alcaligenaceae family shows positive correlations with nasal disease and total immunoglobulin E (IgE) in the high-IgE asthma (HEA) group. (B) Scatter plot of the relative abundance of Betaproteobacterial class, Burkholderiales order, and Alcaligenaceae family shows negative correlations with the dose of oral steroids and sputum eosinophils. (C) Scatter plot of the relative abundance of Betaproteobacterial class, Burkholderiales order, and Alcaligenaceae family shows positive correlations with blood eosinophils in the low-IgE asthma (LEA) group (Spearman’s rank correlation coefficient, P<0.05).

