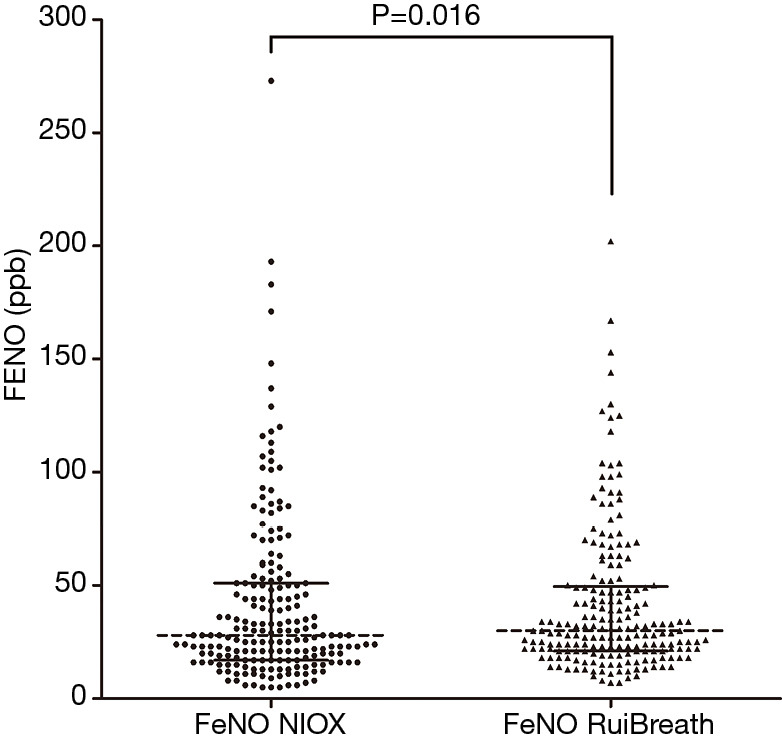
Figure 2.

Scatter plot of the fraction of exhaled nitric oxide (FeNO) values obtained using the NIOX VERO and RuiBreath analyzers. Points represent the FeNONIOX values, and triangles represent the FeNORuibreath values. The solid lines and dotted lines represent the interquartile ranges and the medians, respectively.
