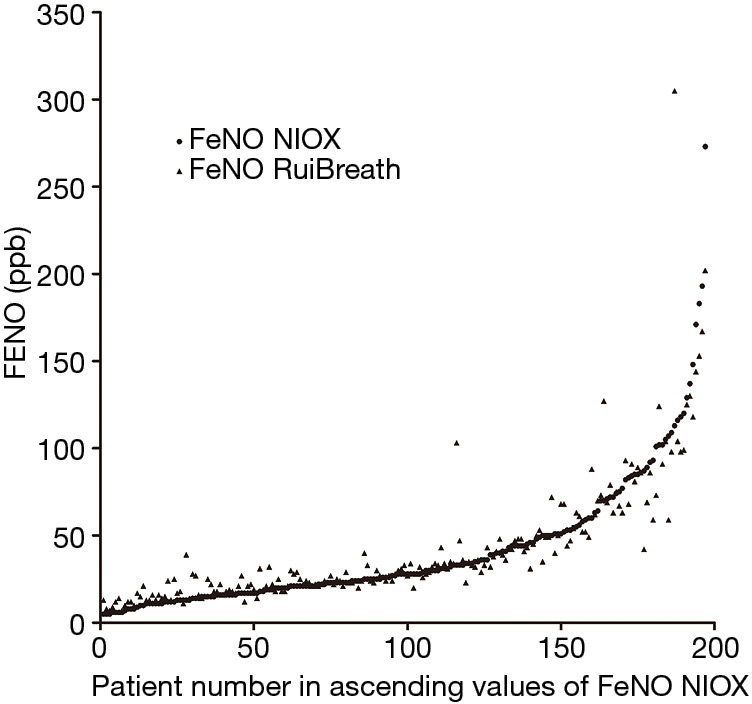
Figure 3.

Point diagram of the pairwise distribution of the fraction of exhaled nitric oxide (FeNO) values measured by Ruibreath and NIOX VERO. The points represent the FeNONIOX values, and the triangles represent the FeNORuibreath values. The diagram was generated according to the increasing FeNONIOX values.
