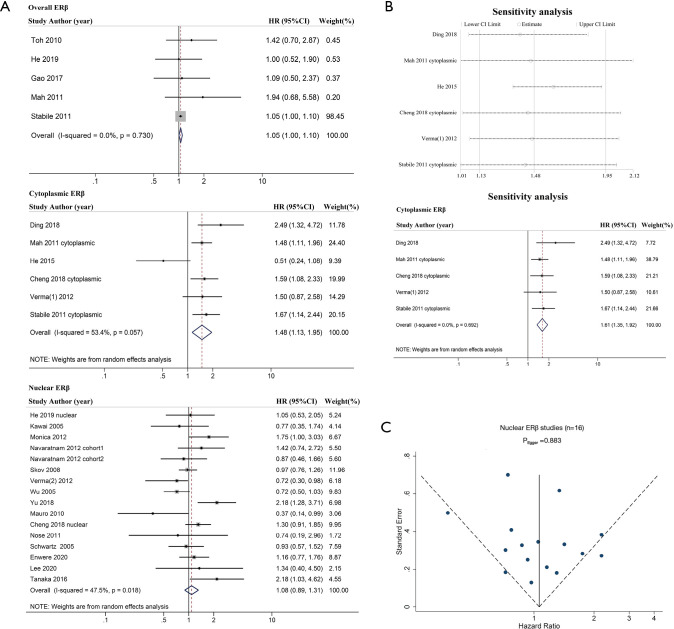
Figure 2.
Forest plots of associations between ERβ protein expression and OS. (A) Effect of overall ERβ, cytoplasmic ERβ, and nuclear ERβ on OS of NSCLC (included lung adenocarcinoma-specific studies). (B) Sensitivity analyses for cytoplasmic ERβ using a leave-one-out strategy and forest plot for cytoplasmic ERβ after exclusion of He et al.’s (in 2015) study. (C) Funnel plot of Publication bias using Egger’s test for nuclear ERβ group. HR, hazard ratio; CI, confidence interval; ERβ, estrogen receptor beta. The size of the blocks or diamonds represents the weight, and the length of the straight line represents the width of 95% CI. Each dot represents a single study in the funnel plot.

