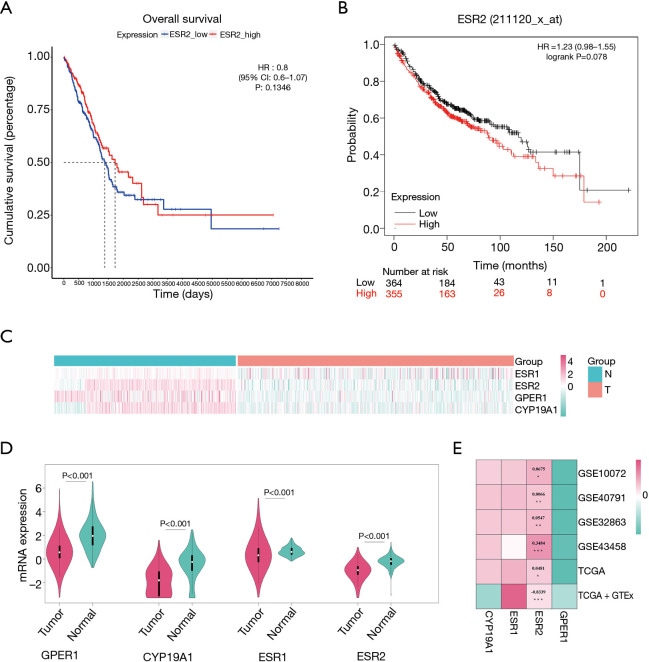
Figure 4.
Survival analysis and differential expression analysis from public databases. (A,B) The Kaplan-Meier curves showing associations between ERβ mRNA expression and overall survival in lung adenocarcinoma. (A) Survival analysis from TCGA-LUAD. (B) Survival analysis from Kaplan-Meier Plotter. (C,D,E) The identification of differentially expressed genes from TCGA-LUAD, GTEx-LUNG, and 4 GEO datasets. (C) Heatmap of differential expression analysis for 4 target genes in the training dataset. (D) Violin plot indicating the expression of 4 target genes between tumor and normal tissues in the training dataset. (E) Heatmap of differential expression analysis for 4 target genes in 4 GEO validation datasets. Every cell representing differentially expressed genes in each dataset is labeled with logFC value and P value (*P<0.05, **P<0.01, ***P<0.001). ESR2, ERβ, estrogen receptor beta; HR, hazard ratio.

