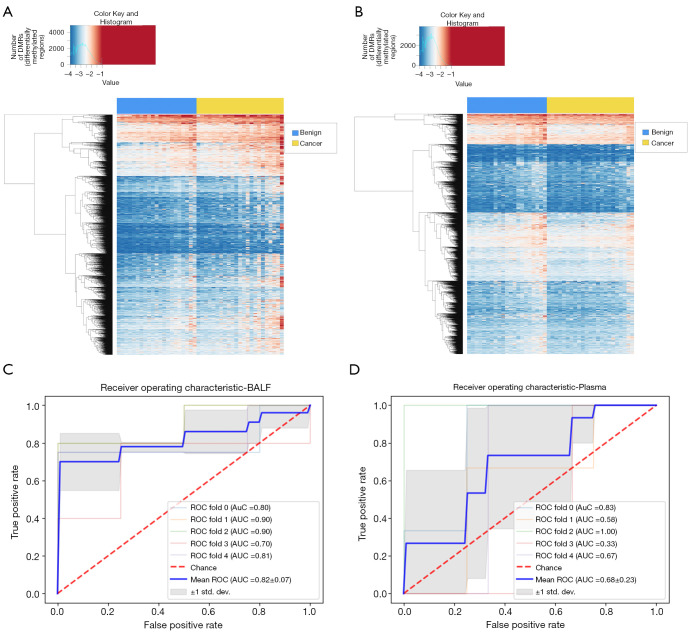
Figure 3.
Visualization and ROC curves of methylation signatures in plasma and BALF cfDNA. (A) BALF supervised clustering heatmap; (B) plasma supervised clustering heatmap; (C) BALF ROC curve; (D) plasma ROC curve. ROC, receiver operating characteristic; BALF, bronchoalveolar lavage fluid; cfDNA, cell-free DNA.

