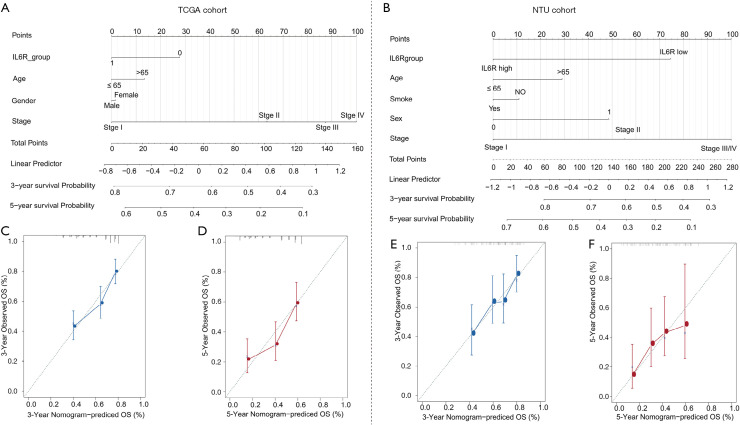
Figure 4.
The prognostic nomogram of lung adenocarcinoma (LUAD) patients based on The Cancer Genome Atlas (TCGA) cohort and NTU cohort data. (A) Generated prognostic nomogram combining IL6R expression (mRNA level) and other risk factors (including gender, age, and TNM stage) from TCGA cohort to predict the clinical outcome of LUAD patients; (B) generated prognostic nomogram that integrates IL6R expression (IHC staining) and other risk factors (including smoking status, gender, age, and TNM stage) from the NTU cohort to predict the clinical outcome of LUAD patients; (C,D) prognostic nomogram calibration curves for 3-year (C) and 5-year (D) survival rates. The gray line represents the ideal model, and the vertical line represents the 95% confidence interval; (E,F) prognostic nomogram calibration curves for 3-year (E) and 5-year (F) survival rates. The gray line represents the ideal model, and the vertical line represents the 95% confidence interval.

