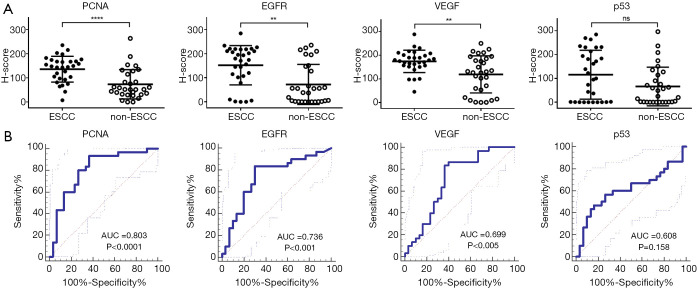
Figure 2.
High expressions of EGFR, PCNA, and VEGF were found in ESCC tissues based on H-score quantifications. (A) The expression levels of the 4 biomarkers were quantified based on the overall H-score analysis for ESCC (filled circles, n=30) and non-ESCC (open circles, n=30). The lower whiskers of the box plot represent the 25% of the data set, and the higher whiskers represent 75% of the data set; the bold black horizontal longer bars represent the median values of the data. P values less than 0.05 were considered statistically significant; ** indicates P<0.01; **** indicates P<0.0001 and ns indicates P>0.05. (B) ROC curves for each individual biomarker. The overall data set (n=60) for the 4 biomarkers was examined in the ROC analysis. The bold curves are mean ROC curves; the higher and lower curves are 95% confidence intervals. PCNA, proliferating cell nuclear antigen; EGFR, epidermal growth factor receptor; VEGF, vascular endothelial growth factor; ESCC, esophageal squamous carcinoma; ROC, receiver operating characteristic curve.

