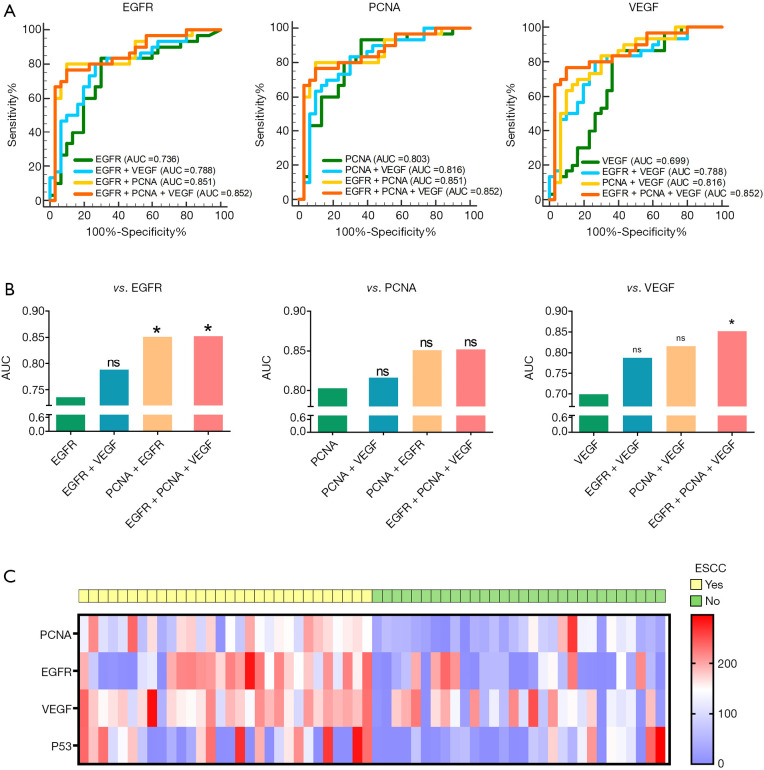
Figure 3.
ROC curves for combined biomarkers and the expression levels of EGFR and PCNA in fresh ESCC samples. (A) ROC curves for combined biomarkers. The overall data set (n=60) for EGFR, PCNA, and VEGF was examined in the ROC analysis. The green solid lines represent a single biomarker; the blue and yellow lines represent a combination of 2 biomarkers; the red lines represent a combination of 3 biomarkers. (B) AUC values derived from the ROC analysis of the combined biomarkers compared to a single biomarker using the Delong’s test. (C) Expressions of PCNA, EGFR, VEGF, and p53 were quantified in ESCC cases (left columns, yellow top bar) and in a control cohort (right columns, green top bar). Each column represents an individual case. The expression of these 4 biomarkers, which were quantitatively described as H-scores, are displayed in heatmap in which red represents high expression, white indicates intermediate expression, and blue indicates low expression. P values less than 0.05 were considered statistically significant; * indicates P<0.05 and ns indicates P>0.05. p53, Protein p53. EGFR, epidermal growth factor receptor; PCNA, proliferating cell nuclear antigen; VEGF, vascular endothelial growth factor; AUC, area under curve; ESCC, esophageal squamous carcinoma; ROC, receiver operating characteristic curve.

