
Figure 6.
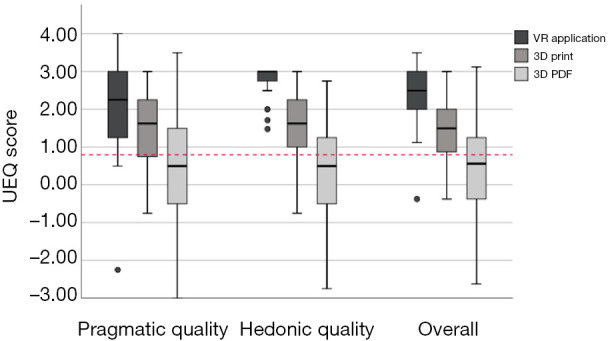
Boxplots of subscores and score values of the User Experience Questionnaire (UEQ) for the three different presentation modalities. Values above 0.8 are defined as positive evaluation results (red dotted line).
Official websites use .gov
A
.gov website belongs to an official
government organization in the United States.
Secure .gov websites use HTTPS
A lock (
) or https:// means you've safely
connected to the .gov website. Share sensitive
information only on official, secure websites.
Boxplots of subscores and score values of the User Experience Questionnaire (UEQ) for the three different presentation modalities. Values above 0.8 are defined as positive evaluation results (red dotted line).