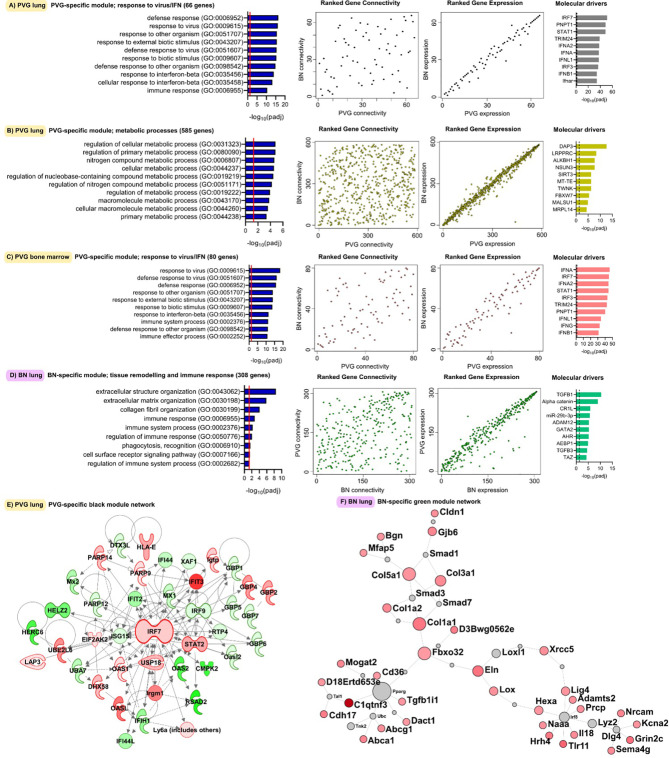
Figure 3.
Functional gene networks unique to either PVG or BN rats. The four gene network modules unique to either PVG lung (A, B), PVG bone marrow (C) or BN lung (D). Over-represented biological pathways are shown for each module, the red line at 1.3 represents the threshold for significance equivalent to a Bonferroni-corrected p-value <0.05. For each network module, ranks of gene connectivity (reflecting the relative importance of that gene within the network module) and gene expression were calculated for both PVG and BN: correlation plots between rat strains are shown. The top ten predicted molecular drivers are shown for each module, where the dashed line represented the threshold for significance. Prior knowledge network reconstructions are shown for the PVG lung black module (E) and the BN lung green module (F) where red and green coloring indicate increased and decreased expression respectively on day 2 (for E) and day 9 (for F) relative to day 0. Sample sizes for network construction: BN bone marrow n = 47, PVG bone marrow n = 49, BN lung n = 48, PVG lung n = 47.

