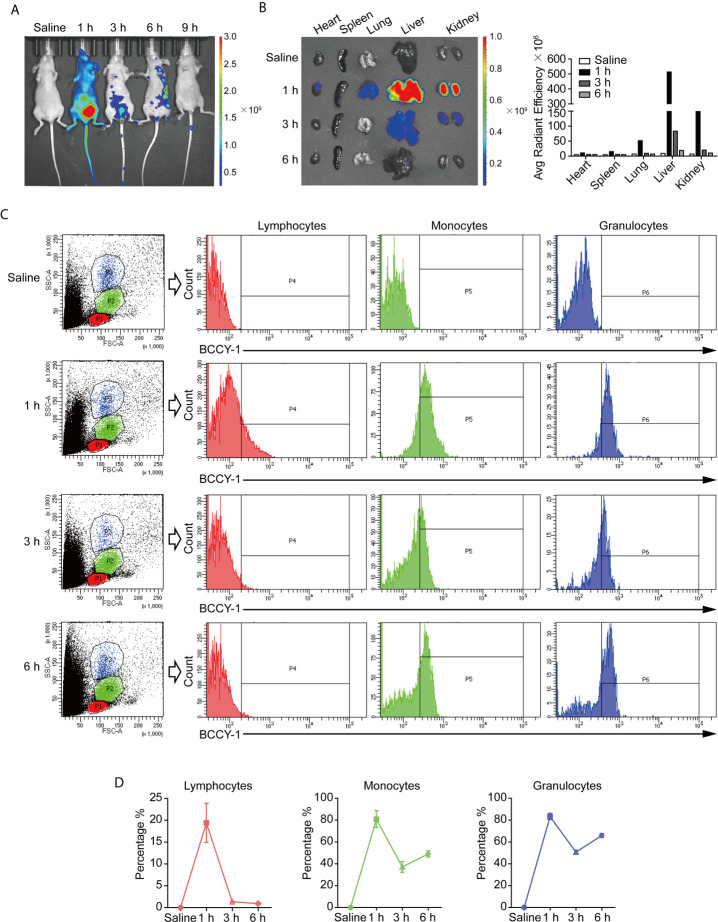
Figure 2.
In vivo biodistribution analysis of BCCY-1. (A) In vivo imaging of mice and (B) ex vivo imaging of major organs at indicated hours after TAMRA-BCCY-1 treatment. Average radiant efficiency ([p/s/cm2/sr]/[μW/cm2]) was quantified at indicated time points. (C, D) The biodistribution of BCCY-1 in peripheral blood cells (lymphocytes, monocytes and granulocytes) was analyzed by flow cytometry at indicated hours. The percentage of TAMRA positive cells in the indicated cell population was quantified.

