Figure 1.

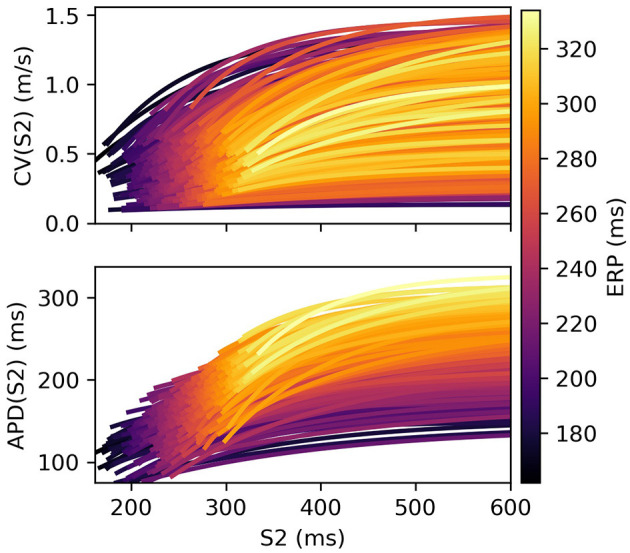
S2 restitution curves for S1: 600 ms for CV(S2) and APD(S2), colored by ERP(S1: 600), and plotted only for S2 > ERP(S1: 600) for clarity.

S2 restitution curves for S1: 600 ms for CV(S2) and APD(S2), colored by ERP(S1: 600), and plotted only for S2 > ERP(S1: 600) for clarity.