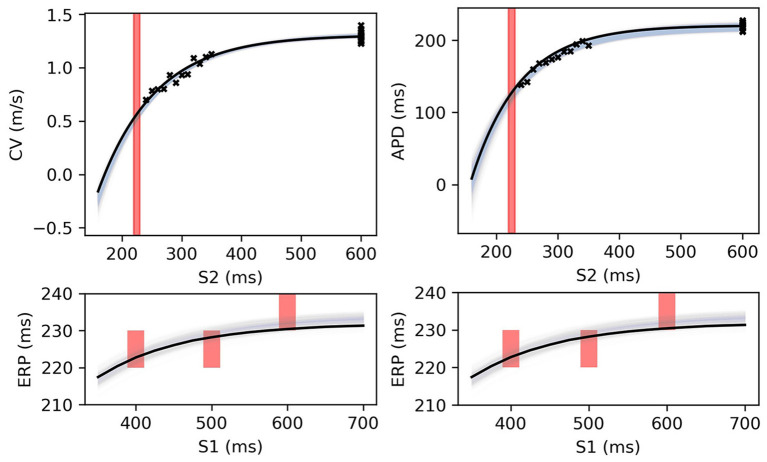
Figure 12.
RCE predictions, shown as lightly shaded regions representing 95% confidence intervals, for 100 parameter samples from the posterior distribution given the same measurements shown in Figure 8 (black crosses are noisy S2 restitution data, red bars are observed ERP intervals). MCMC utilized CV(S2), APD(S2), and ERP(S1) data simultaneously, unlike in Figures 8, 9.

