
Figure 13.
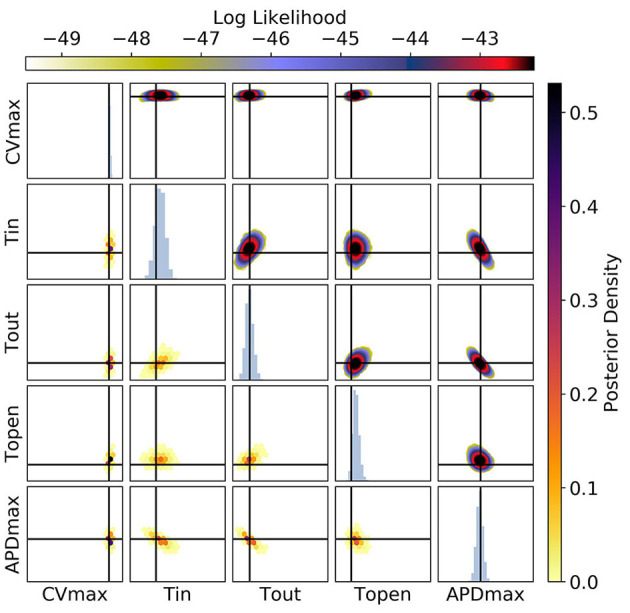
The posterior parameter distribution for calibration to CV(S2), APD(S2), and ERP(S1) measurements simultaneously. The intersection of vertical and horizontal lines mark the true parameter value. The lower diagonal shows the density via hexbin plots, while the upper diagonal shows the log likelihood values for each sample plotted in order of increasing likelihood. The diagonals show the marginal histograms of each parameter.