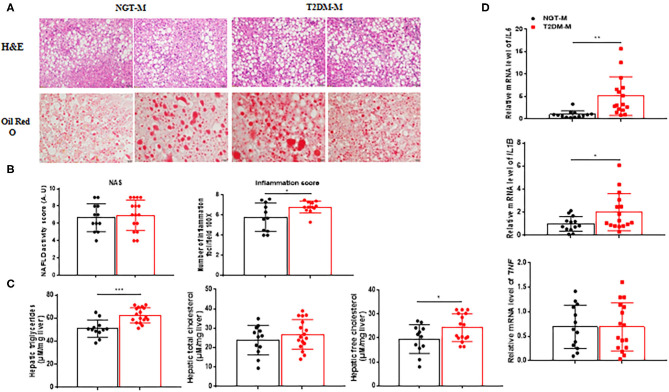
Figure 3.
Steatohepatitis was exacerbated in T2DM-M group compared with NGT-M group. (A) Representative liver HandE staining (magnification, ×200; scale bar: 50 μm) and Oil Red O staining (magnification, ×400; scale bar: 20 μm) (n = 13–17). (B) Hepatic histological analysis of HandE staining (NAS and lobular inflammation score) (n = 11–16). (C) Hepatic triglycerides and (free) cholesterol levels (n = 12–17). (D) Quantitative real-time RT-PCR analysis of TNF IL1B IL6 mRNA expressions in the liver from MAFLD patients (n = 13–16). The data are expressed as the mean ± SD, *P < 0.05, **P < 0.01, and ***P < 0.001.

