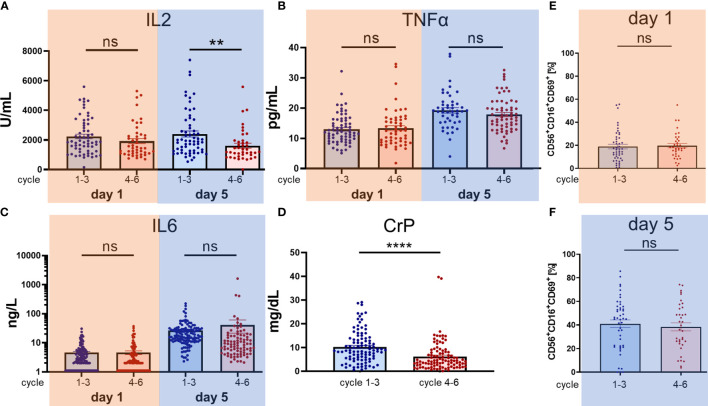
Figure 3.
Comparison of cytokine secretion and activation of NK cells during cycles 1–3 without IL2 administration and cycles 4–6 with low dose subcutaneous IL2 administration. In contrast to cycles 1–3 starting as early as 60 days post haploidentical HSCT, in cycles 4–6 at days 6, 8, and 10 subcutaneous IL2 is administered at 1E06 IU/m2/day. Consequently, we performed a systematic analysis and comparison of cytokine secretion and the activation of NK cells between the cycles 1–3 versus the cycles 4–6. We compared the levels of the proinflammatory cytokines (A) IL2, (B) TNFα, (C) IL6 and (D) CrP in serum of patients or lithium heparin plasma and the percentage increase in number of activated NK cells (E, F). Every single dot represents an independent single value per cycle and patient used from cycles 1–6 (A–D) but as indicated in (E) cycles 1–3 and (F) cycles 4–6. For the comparison of (A) IL2 day 1 ncycles 1–3 = 62/ncycles 4–6 = 46, day 5 ncycles 1–3 = 62/ncycles 4–6 = 41, (B) TNFα day 1 ncycles 1–3 = 67/ncycles 4–6 = 55, day 5 ncycles 1–3 = 63/n cycles 4–6 = 47, (C) IL6 day 1 ncycles 1–3 = 129/ncycles 4–6 = 97, day 5 ncycles 1–3 = 125/ncycles 4–6 = 86 was available in pair values and for (D) CrP n = 99 single values were used. NK cell immunophenotype was assessed by flow cytometry and was defined as the CD56+CD16+ and CD3− subset of lymphoid cells. The early activation marker CD69 was used to distinguish resting (CD69−) from activated (CD69+) NK cells, day 1 and 5 ncylces 1–3 = 47, ncylces 4–6 = 36, day 1 p = 0.78, day 5 p = 0.58. Statistical analysis was done by two-tailed unpaired t-test. P-values below 0.05 were defined significant. ** = <0.01, **** = <0.0001. ns, not significant.

