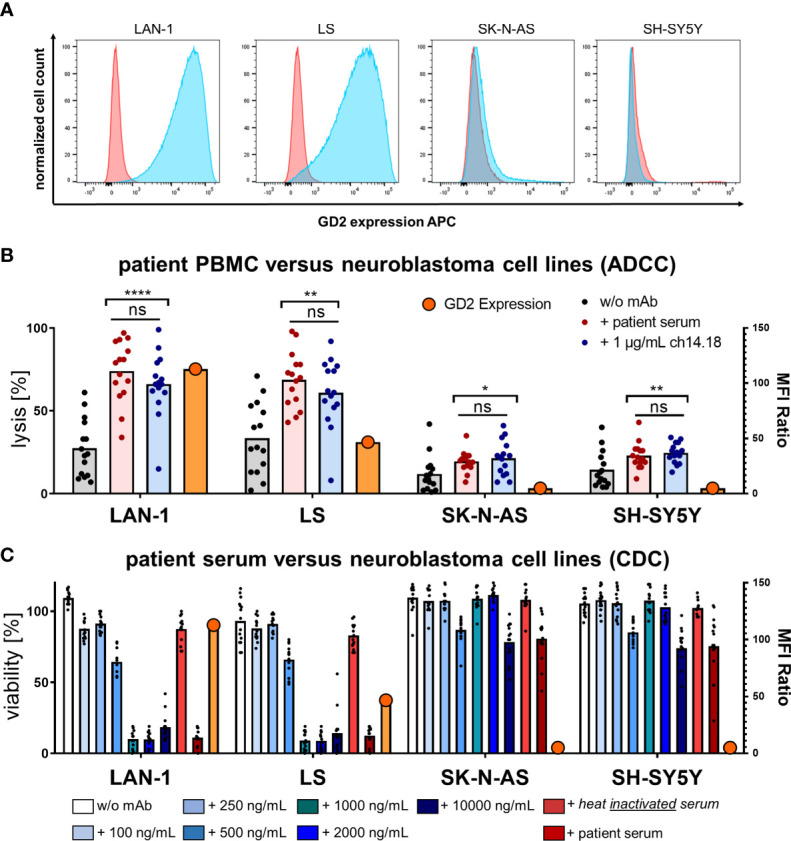
Figure 5.

GD2 expression and cytolysis of neuroblastoma cell lines via ADCC and CDC by PBMCs and serum of patients. (A) GD2 expression of the neuroblastoma cell lines LAN-1, LS, SK-N-AS, and SH-SY5Y was measured by flow cytometry using primary labeled GD2 PE (clone 14G2a) mAb and a mouse IgG2a, k PE mAb as isotype control. The median fluorescence intensity (MFI) was used to calculate the MFI ratio (MFIR) by the MFI GD2 PE mAb divided by MFI isotype control IgG2a, k PE mAb. Representative univariate histograms are shown. From left to right panels the relative GD2 expression declines MFIR LAN-1 = 112.9 > MFIR LS = 46.8 > MFIR SK-N-AS = 1.3 > MFIR SH-SY5Y = 1. (B) Patient PBMCs acquired post haploidentical HSCT were used to test the direct cellular cytotoxicity and ADCC at an effector to target ratio E:T 5:1 of PBMCs versus the indicated neuroblastoma cell line in a 24 h luciferase-based kill assay. Specific lysis was assessed in the conditions I) PBMCs without mAb versus tumor, II) PBMCs plus patient serum versus tumor, III) PBMCs plus 1 µg/ml ch14.18/CHO mAb versus tumor. (C) CDC was tested in a coincubation of human serum from healthy volunteer donors (HVDs) at different levels of concentrations of added ch14.18/CHO mAb or heat-inactivated serum of patients or serum of patients versus the indicated neuroblastoma cell lines in a 24 h luciferase-based kill assay without adding any effector cells. Data shown in (B) represent mean of triplicates of (n = 15) independent experiments; data shown in (C) represent (n = 3) independent experiments of (n = 15) different donors in (B, C), respectively. Statistical significance was determined by one-way ANOVA and Tukey post-hoc test. P-values below 0.05 were defined significant. ADCC, antibody-dependent cellular cytotoxicity; CDC, complement-dependent cytotoxicity; HVD, healthy volunteer donor. * = <0.05, ** = <0.01, **** = <0.0001. ns, not significant.
