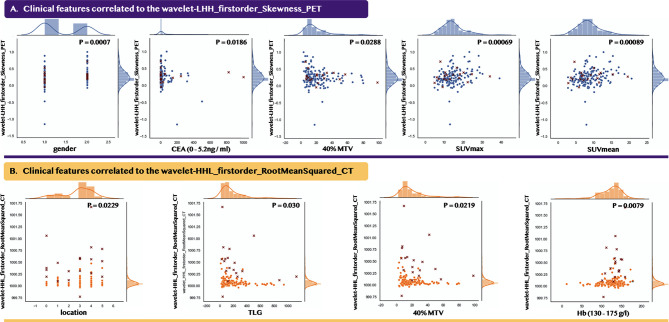
Figure 6.
Data distribution between the selected radiomic features and their statistically correlated clinical features. Point mark and cross mark indicate the patients from the 2010–2018 and 2018–2020 periods, respectively. (A) indicates the PET feature, while (B) indicates the CT feature. For gender and location, we applied the Point-Biserial correlation method, while for the other clinical features, we applied the Pearson correlation method.

