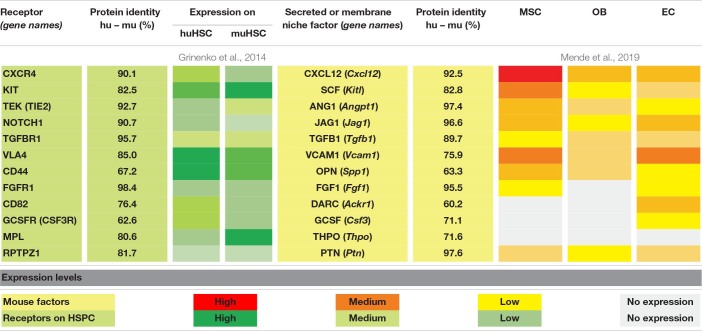
TABLE 1.
Overview of molecular interaction partners between human/mouse HSCs and mouse bone marrow niche cells.
 |
Color intensity contains information on the amount of transcripts encoding for either receptors expressed by human/mouse HSCs (green) or factors expressed by indicated niche cells (red/yellow). Color intensity was introduced based on read counts from bulk sequencing approaches using prospectively isolated mouse (CD45/Ter119/Lin)– CD31– CD144– CD51+ SCA1– PDGFRa+ MSC or PDGFRa– OB, and (CD45/Ter119/Lin)– CD31+CD144+ EC (Mende et al., 2019)and human and mouse HSCs (Grinenko et al., 2014). Protein sequence identity between human and mouse receptors and ligands were calculated using BLAST implemented in UniProt (UniProt Consortium, 2021).
