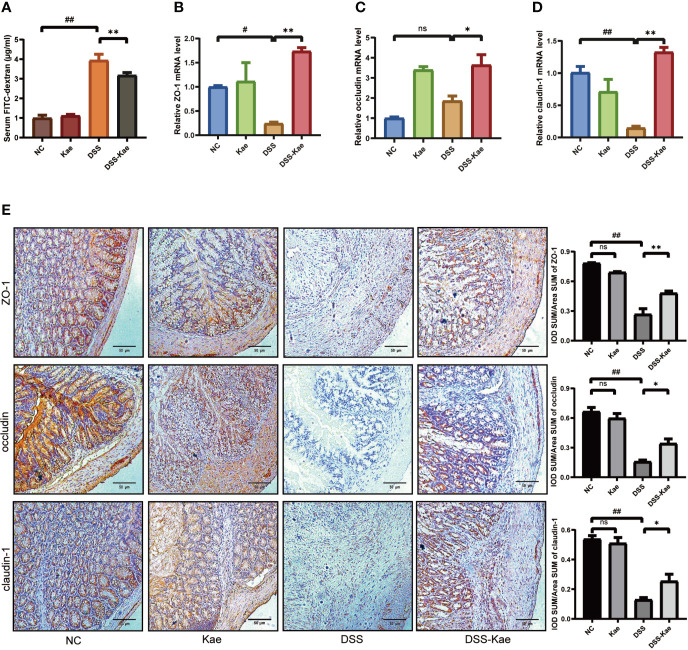
Figure 3.
Kae improves gut permeability and enhances expression of intestinal tight junction proteins. Relative mRNA levels analysis of (A) Quantification of serum FITC-dextran. (B) ZO-1, (C) occludin, and (D) claudin-1. (E) Representative images of immunohistochemical staining of ZO-1, occludin, and claudin-1 in colon samples from different experimental groups (scale bar, 50 μm). Positive protein integral optical density was determined using Image J 1.5.7 software. Data are expressed as the mean ± SEM, n = 5–6, analyzed using one-way ANOVA with Tukey post-hoc analysis. DSS (vs. NC, # P < 0.05, ## P < 0.01; vs. DSS-Kae, *P < 0.05, **P < 0.01); ns, no significant difference.

