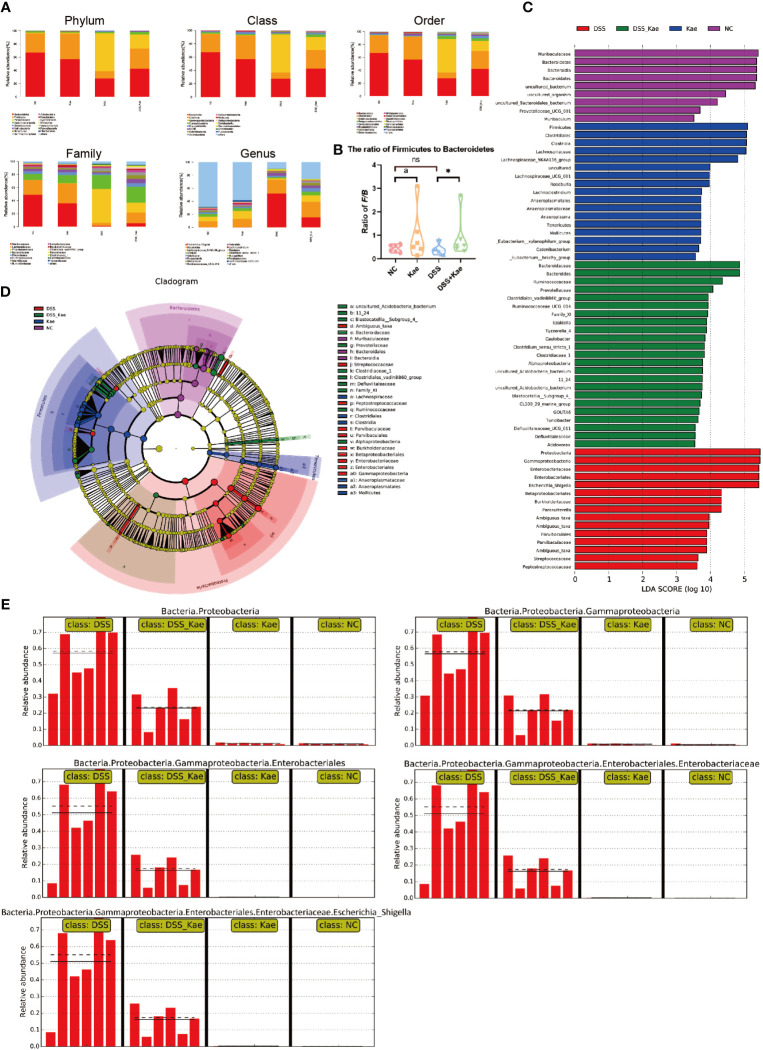
Figure 5.
(A) Taxonomic analysis of microbiota in fecal samples at the phylum, class, order, family, and genus levels. (B) Ratio of Firmicutes to Bacteroidetes in the gut microbiota. (C) LDA scores for bacterial taxa significantly enriched in gut microbiota from each group (LDA score > 3). (D) Cladogram illustrating the results of LEfSe analysis. (E) All-against-all algorithm of LDA coupled with LEfSe. Ratios are expressed as the mean ± SEM, n = 6, analyzed using one-way ANOVA with Tukey post-hoc analysis. DSS (vs. DSS-Kae, *P < 0.05); Kae (vs. NC, a P < 0.05); ns, no significant difference. The significance of differences in taxonomic groups were assessed using the non-parametric factorial Kruskal-Wallis sum-rank test, n = 6. P < 0.05 was considered to indicate a significant difference between groups.

