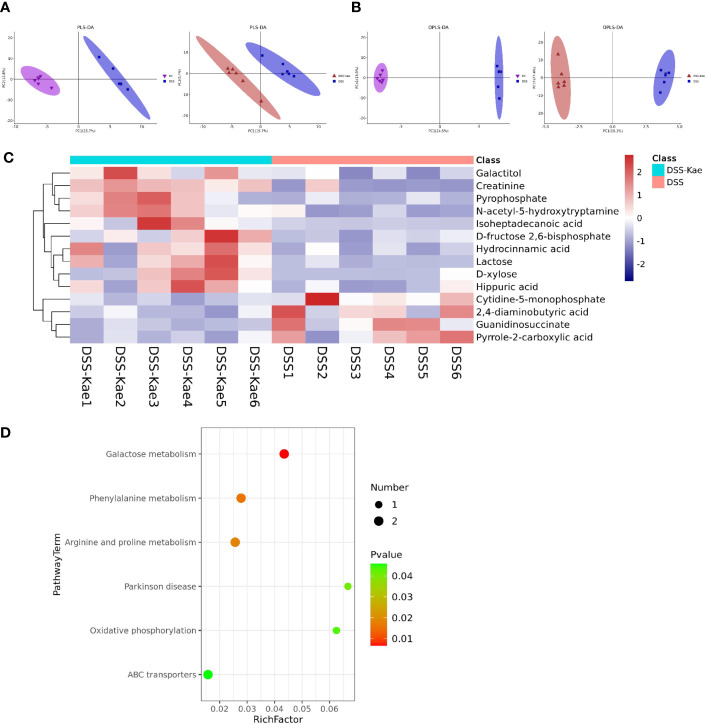
Figure 6.
Kae altered fecal metabolic composition. (A) PLS-DA analysis score plot showing comparisons of the NC vs DSS and DSS vs DSS-Kae group metabolome profiles. (B) OPLS-DA analysis score plots showing comparisons of the NC vs DSS and DSS vs DSS-Kae group metabolome profiles. (C) Heat map showing metabolites differing significantly in abundance between the DSS and DSS-Kae groups. (D) KEGG pathway analysis of the DSS and DSS-Kae groups. Statistical analysis was conducted by calculation of Pearson correlation coefficients (VIP > 1 and P < 0.05).

