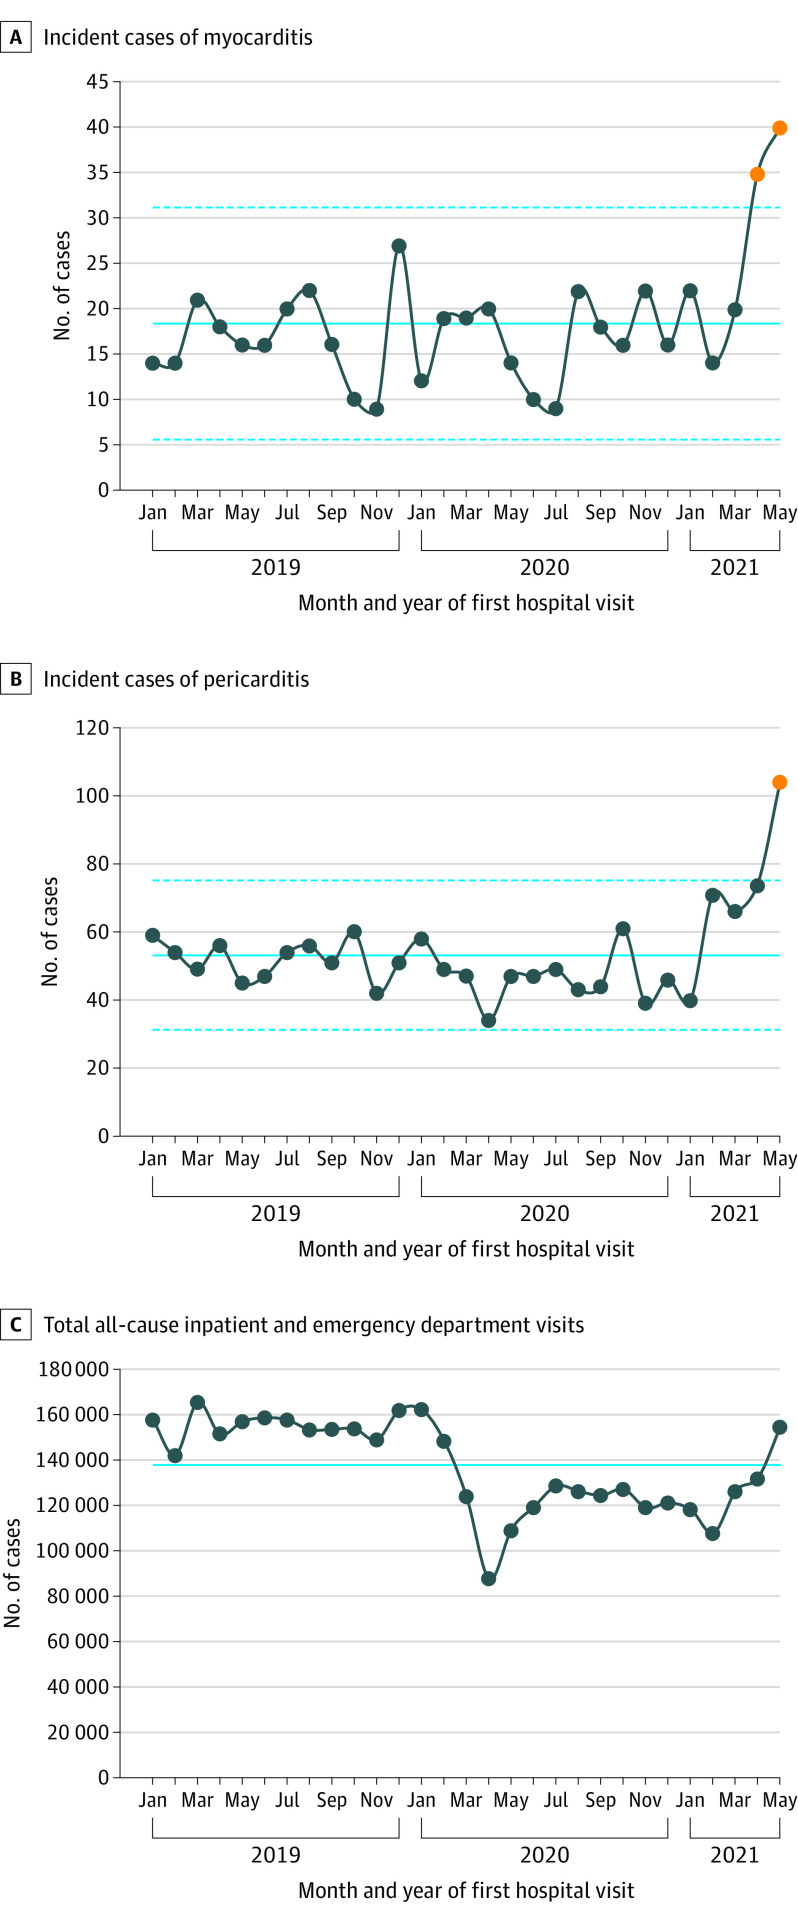
Figure. Monthly Number of Inpatient and Emergency Department Cases of Myocarditis and Pericarditis at 40 Hospitals in the Western US.
A statistical process control c-chart was used for panels A and B, with control limits at ±3 times the standard deviation of the overall count. Orange circles are counts outside the control limits. Solid lines are incidence over the entire time frame; dashed lines are the ±3 sigma (control limits) about the incidence over the entire time frame.

